June’s $30.3 billion of construction starts, excluding residential work, was almost unchanged versus May, -1%, according to CMD Group. Starts treaded water in the latest month, which is unusual given CMD’s long-term May-to-June gain, due to seasonality, of 4.5%.
June’s month-to-month inertia was a pause after May’s extraordinary 37.3% leap. May included a couple of mega-sized project groundbreakings, the likes of which weren’t repeated in June.
Year-to-date starts in 2015 have also been -1% relative to the same January-to-June period of last year. Compared with its counterpart month last year, standalone June in 2015 was -4.8%.
The starts figures throughout this report are not seasonally adjusted (NSA). Nor are they adjusted for inflation. They are expressed in what are termed ‘current’ as opposed to ‘constant’ dollars.
‘Nonresidential building’ plus ‘engineering/civil’ work accounts for a considerably larger share of total construction than residential activity. The former’s combined proportion of total put-in-place construction in the Census Bureau’s May report was 63%; the latter’s was 37%.
CMD’s construction starts are leading indicators for the Census Bureau’s capital investment or put-in-place series. Also, the reporting period for starts (i.e., June 2015) is one month ahead of the reporting period for the investment series (i.e., May 2015.)
According to the Bureau of Labor Statistics (BLS), employment in the U.S. construction sector also stayed flat in June relative to May. The year-over-year increase, however, has been a more-than-respectable 259,000 jobs. The first half of 2015 has contributed 105,000 net new positions.
Total non-farm employment nationwide has been 2.1% year over year. Construction’s increase has been exactly twice as fast, 4.2%. The unemployment rate in construction is currently 6.3% (not seasonally adjusted), a decline of almost two percentage points from last year’s 8.2% in the same month.
Before there can be on-site construction activity, projects must be contemplated and planned by owners and rendered into working drawings by design professionals. In June, the year-over-year rise in architectural and engineering services employment maintained a strong pace, 3.6%.
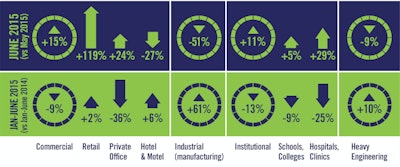
Month to month in June, the commercial (14.8%) and institutional (10.9%) type-of-structure categories recorded increases in starts. They were offset by engineering’s decline (-8.5%).
Industrial starts also dropped, by half (-50.5%), but this category of work plays a smaller role in the total. There were no industrial project starts in June equivalent to the initiation of work on Tesla Motors’ Nevada battery gigafactory in May, carrying an estimated value of $2 billion. Although that’s not to slight a $1 billion start on a methanol plant in St. James, La.
When this year’s individual month of June is compared with the same month last year, the sub-category percentage changes are muted. Institutional work advanced (2.6%), but the heavy engineering/civil category declined (-1.1%), as did commercial (-2.2%).
The smaller category of industrial starts took a nosedive (-54.8%). Industrial percentage changes are often highly variable depending on the presence, or absence, of a large project or two.
With respect to year-to-date starts, heavy engineering (10.2%) has been ‘riding point’. Institutional (-12.9%) and commercial (-9.4%) have been less eager to keep up.
Industrial (61.2%) year-to-date starts are a source of encouragement.
Within engineering starts, the biggest subcategory by far is road/highway work. In June, it was -4.1% month to month (m/m) and only 0.8% when compared with the same month of last year (y/y); but it was an expansive 14.4% through this year’s first half versus last year’s (ytd).
Next most important in engineering, water/sewage starts were also so-so in the individual month of June (0.1% m/m and -4.9% y/y), but more promising on an accumulated basis (6.2% ytd).
As for institutional, the year-to-date dollar volume of educational facility starts is currently five times greater than for health care projects. School/college starts in June were 5.3% m/m; -14.1% y/y; and -8.5% ytd. So far this year, in contrast to college/universities (-13.1% ytd) and junior/senior high schools (-20.2% ytd), elementary/pre-schools have been upbeat (11.5% ytd).
Hospital/clinic starts surged in the individual month of June (29% m/m and 79.6% y/y), but remained lower by one-quarter (-25.4%) year-to-date. The recent Supreme Court ruling to solidify the Patient Protection and Affordable Care Act provides more stability for investment decisions. Besides, employment growth in the health care field is a robust 2.9% year over year.
Retail starts in commercial work leapt forward in June (118.8% m/m; 63.4% y/y; and 2.3% ytd), as did the miscellaneous commercial category (10.7% m/m; 107.8% y/y; and 5.6% ytd). A major subcomponent within the latter is sports/convention centers (67.7% ytd).
Elsewhere in commercial, though, there were hiccups. Private office buildings may have been 23.5% m/m, but they were -42.3% y/y and -35.5% ytd. Government office buildings were -8.3% m/m; 6.8% y/y; and -18.6% ytd.
According to June’s Employment Situation report from the BLS, construction’s average hourly earnings in June, at 2.4% year over year, modestly outpaced the gain for all sectors, 1.9%. Construction displayed a frothier advance in average weekly earnings, 2.9% versus 1.6%.
The value of construction starts each month is summarized from CMD’s database of all active construction projects in the U.S. Missing project values are estimated with the help of RSMeans’ building cost models.
CMD’s nonresidential construction starts series, because it is comprised of total-value estimates for individual projects, some of which are mega-sized, has a history of being more volatile than many other leading indicators for the economy.
A “start” is determined by taking the announced bid date and adding a short time lag (30 to 60 days). CMD continues to follow the project via its network of researchers. If it is abandoned or re-bid, the start date is updated to reflect the new information.