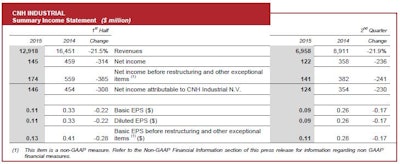
CNH Industrial N.V. today announced consolidated revenues of $6,958 million for the second quarter of 2015, down 10.0% compared to Q2 2014 on a constant currency basis (21.9% on a reported basis). Net sales of Industrial Activities were $6,634 million in Q2 2015, down 10.0% compared to Q2 2014 on a constant currency basis (22.5% on a reported basis).
Excluding the negative impact of currency translation, net sales increased for Commercial Vehicles (up 11.9%) confirming a positive trend in EMEA for trucks and buses. This increase was more than offset by the forecasted protracted decline in Agricultural Equipment, driven by lower industry volumes in the row crop sector and dealer inventory de-stocking actions, primarily in NAFTA, slightly offset by favorable net pricing in all regions. Furthermore, net sales decreased in Construction Equipment, due to negative industry volumes primarily in LATAM, and in Powertrain, due to lower sales to captive customers.
Operating profit of Industrial Activities was $401 million in Q2 2015, a $257 million decrease compared to Q2 2014 on a constant currency basis (down $277 million on a reported basis), with an operating margin for the second quarter of 6.0%, down 1.9 p.p. compared to Q2 2014. Operating profit declined in Agricultural Equipment, driven by negative volume and product mix in the row crop sector, primarily in NAFTA, and negative foreign exchange impacts, primarily resulting from the weakening of the euro and the Brazilian real. These negative factors were partially offset by positive net pricing, and cost control actions including purchasing efficiencies and structural cost reductions. Commercial Vehicles’ operating result improved due to favorable volume, product and market mix, and pricing, as well as manufacturing efficiencies and cost reductions in selling, general and administrative (“SG&A”) expenses. Construction Equipment’s operating profit improved as cost containment actions more than offset the negative impact from lower volume in LATAM, primarily in Brazil. Net of the negative impact of currency translation, Powertrain’s operating profit was substantially flat, as a result of lower volumes offset by favorable product mix and manufacturing efficiencies.
Construction Equipment
Construction Equipment’s net sales were $740 million for the quarter, down 14.8% compared to Q2 2014 on a constant currency basis (down 20.5% on a reported basis), due to negative industry volumes primarily in LATAM. The geographic distribution of net sales for the period was 58% NAFTA, 20% EMEA, 12% LATAM and 10% APAC.
In Q2 2015, Construction Equipment’s worldwide heavy and light industry sales were down 18% and 1%, respectively. Industry light equipment sales were up in NAFTA and EMEA, but down in LATAM and APAC. Industry heavy equipment sales decreased in all regions, primarily in LATAM and APAC. Construction Equipment’s worldwide market share was mainly in line with prior year for both heavy and light construction equipment in all regions except for LATAM, where municipality-driven demand declined significantly as infrastructure investments, where the Company has a significant position, slowed. Construction Equipment’s worldwide production levels were 16% above retail sales in the quarter to accommodate seasonal shutdowns scheduled for the third quarter in NAFTA and EMEA.
Construction Equipment reported operating profit of $35 million for the second quarter compared to $28 million for Q2 2014. Operating margin increased 1.7 p.p. to 4.7% (3.0% in Q2 2014), as cost containment actions more than offset the negative impact from lower volume in LATAM, primarily in Brazil.
Commercial Vehicles
Commercial Vehicles’ net sales were $2,470 million for the quarter, up 11.9% compared to Q2 2014 on a constant currency basis (down 8.7% on a reported basis), confirming a positive trend in EMEA for trucks and buses. In APAC, net sales increased mainly driven by positive performance of buses, while trucks’ performance was affected by the market decline in Russia. In LATAM, net sales decreased mainly due to a further decline in the Brazilian market for heavy trucks, partially offset by a modest market recovery in Argentina. The geographic distribution of net sales for the period was 77% EMEA, 14% LATAM and 9% APAC.
The European truck market (GVW ≥3.5 tons) was up 17.4% compared to Q2 2014. The light vehicle market (GVW 3.5-6.0 tons) increased 15.2%, the medium vehicle market (GVW 6.1-15.9 tons) increased 6.3% and the heavy vehicle market (GVW ≥16 tons) increased 24.1%. In LATAM, new truck registrations (GVW ≥3.5 tons), declined 35.2% compared to Q2 2014, with a decrease of 44.3% in Brazil and 26.3% in Venezuela, while Argentina increased by 26.1%. In APAC registrations declined 6.3%. In Q2 2015, the Company’s market share in the European truck market (GVW ≥3.5 tons) was 11.5%, up 0.6 p.p. compared with Q2 2014. The Company’s market share in LATAM was 12.5%, up 3.2 p.p. compared to Q2 2014.
Commercial Vehicles delivered approximately 37,800 vehicles (including buses and specialty vehicles) in the quarter, representing a 14% increase compared to Q2 2014. Volumes were higher in all segments, with light up 14%, medium up 18% and heavy up 7%. Commercial Vehicles’ deliveries increased 22% in EMEA, while LATAM and APAC were down 8% and 17%, respectively.
Commercial Vehicles’ Q2 2015 ending book-to-bill ratio was 1.06, an increase of 17% over Q2 2014. Second quarter 2015 truck order intake in EMEA increased 49% compared to Q2 2014, with a 62% increase in heavy trucks in Europe.
Commercial Vehicles closed the second quarter with an operating profit of $67 million compared to a loss of $21 million for Q2 2014 (up $89 million on a constant currency basis), with an operating margin of 2.7% (negative margin of 0.8% in Q2 2014), as a result of higher volume, better product and market mix, positive pricing, manufacturing efficiencies and SG&A expense reductions. In EMEA, the increase in operating profit is mainly attributable to trucks and buses. Results in APAC were substantially flat compared to Q2 2014. LATAM, despite the significant negative market trend in Brazil, was able to reduce its cost base to partially offset the negative impact of reduced wholesale volumes. Furthermore, LATAM performance was positively impacted by a modest improvement in Argentina and a recovery of Company’s activity in Venezuela. However, the continuing economic uncertainty in Venezuela, including changes to government currency control mechanisms, may substantially impact Venezuelan operations in the future. CNH Industrial will continue to closely monitor these developments.
Powertrain
Powertrain’s net sales were $947 million for the quarter, a decrease of 6.9% compared to Q2 2014 on a constant currency basis (down 24.2% on a reported basis), on lower volumes mainly in the captive portion of the business as a result of decreased agricultural equipment demand and the 2014 build-up of Tier 4 final transition engine inventory for the off-road segment. Sales to external customers accounted for 42% of total net sales (41% in Q2 2014).
During the quarter, Powertrain sold approximately 134,800 engines, a decrease of 16% compared to Q2 2014. By major customer, 10% of engine units were supplied to Agricultural Equipment, 35% to Commercial Vehicles, 4% to Construction Equipment and the remaining 51% to external customers. Additionally, Powertrain delivered approximately 20,900 transmissions and 51,800 axles, an increase of 14% and 17%, respectively, compared to Q2 2014.
Powertrain’s operating profit was $53 million for the quarter, down $11 million compared to Q2 2014, with an operating margin of 5.6% (up 0.5 p.p. compared to Q2 2014). Net of the negative impact of currency translation, operating profit was substantially flat, as a result of lower volumes offset by favorable product mix and manufacturing efficiencies.
2015 U.S. GAAP Guidance
As a result of continued demand weakness in the agricultural row crop sector and in order to foster additional clearing of finished goods inventory, primarily in the North American and LATAM markets, the Company will adjust production accordingly in the second half of 2015.
Full year guidance is therefore updated as follows to reflect the negative impact on operating margin and the positive impact on working capital due to these production adjustments:
- Net sales of Industrial Activities in the range of $26-27 billion, with an operating margin of Industrial Activities between 5.6% and 6.0%;
- Net industrial debt at the end of 2015 between $2.0 billion and $2.2 billion.