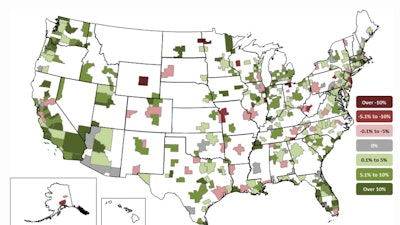
Construction employment increased in 264 out of 358 metro areas between June 2016 and June 2017, declined in 57 and stagnated in 37, according to a new Associated General Contractors of America analysis of federal employment data. Association officials noted that even though most metro areas added construction jobs, the employment gains were particularly pronounced in the western third of the country.
“Western metro areas, from southern California and Nevada to Oregon and Washington, logged many of the largest absolute and percentage increases in construction employment in the past year,” said Ken Simonson, the association’s chief economist. “In contrast, the metros with the largest job losses were all in the middle or eastern portions of the country.”
Riverside-San Bernardino-Ontario, Calif. added the most construction jobs during the past year (18,100 jobs, 20%), followed by:
- Los Angeles-Long Beach-Glendale, Calif. (10,400 jobs, 8%)
- Las Vegas-Henderson-Paradise, Nev. (9,900 jobs, 18%)
- Portland-Vancouver-Hillsboro, Ore.-Wash. (8,200 jobs, 13%)
- Tampa-St. Petersburg-Clearwater, Fla. (8,200 jobs, 12%)
The largest percentage gains occurred in the Bloomington, Ill. metro area (63%, 1,900 jobs) followed by:
- Lewiston, Idaho-Wash. (29%; 400 jobs)
- Lake Charles, La. (24%, 4,700 jobs)
- Riverside-San Bernardino-Ontario; Detroit-Dearborn-Livonia, Mich. (19%, 4,200 jobs)
- Merced, Calif. (19%, 400 jobs)
The largest job losses from June 2016 to June 2017 were in Houston-The Woodlands-Sugar Land, Texas (-5,200 jobs, -2%), followed by:
- Middlesex-Monmouth-Ocean, N.J. (-2,900 jobs, -7%)
- St. Louis, Mo.-Ill. (-2,600 jobs, -4%)
- Kansas City, Mo. (-1,900 jobs, -7%)
- Toledo, Ohio (-1,800 jobs, -11%)
The largest percentage decreases for the year were in Grand Forks, N.D.-Minn. (-21%, -1,000 jobs) followed by:
- Danville, Ill. (-17%, -100 jobs)
- Casper, Wyo. (-12%, -400 jobs)
- Toledo and Charleston, W.Va. (-10%, - 700 jobs)
Association officials noted that inconsistent metro area job growth was coupled with declining construction spending figures released yesterday. They urged Congress and the White House to act quickly to fund and finance needed upgrades to the nation’s aging infrastructure. These new investments would help boost demand for construction across more areas and provide the kind of improved infrastructure needed to support broader economic growth.
“Finding new ways to fund and finance needed infrastructure repairs will help ensure that construction job growth remains both widespread and robust,” said Stephen E. Sandherr, the association’s chief executive officer. “More important, modernizing our aging and overused public works will make our economy more efficient and help boost overall economic growth.”
View the metro employment data by rank and state.


