Currently, the rebound hammer is widely used for estimation of compressive strength of concrete as general testing method. Although rebound hammer has made great contribution for compressive strength test of concrete structures through its long history, its measurement accuracy and application is still considered as debatable. On the other hand, the mechanical impedance method is proposed as a new method for estimation of compressive strength in these days.
Although both methods require direct impact on concrete surface in order to estimate compressive strength, basic principle is different. The rebound number, that rebound hammer measures, is depending on the degree of absorption of kinetic energy during the plastic deformation process of concrete surface generated by hammering. On the other hand, the mechanical impedance method measures mechanical impedance between a hammer and concrete surface at the contact point. The mechanical impedance is derived from Young’s modulus, and is used for estimation of compressive strength of concrete. This study shows consideration for basic principle of the mechanical impedance method for compressive strength estimation of concrete, and its application and measurement accuracy are discussed through a field experiment.
Basic Principles of Mechanical Impedance Method
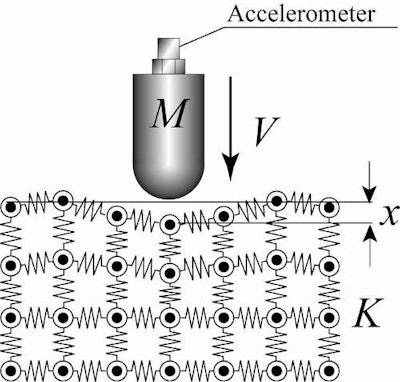 Figure 1: Collision model of hammer.Nitto Construction Inc.
On the other hand, putting the maximum displacement as Dmax and the strain energy (EC) of concrete by hammer impact is, EC=1/2KDmax2 (equation 2).
Considering equilibrium of energy, 1/2MV02=1/2KD2max (equation 3).
From the Hooke's law, the maximum impact force Fmax is, Fmax=KDmax (equation 4).
Solve for Dmax, and substitute the formula for the equilibrium of energy, 1/2MV02=1/2K F2max / K2 ⇒ K = 1/M * (Fmax/V0)2 (equation 5).
From the above, when the maximum impact force Fmax and the velocity of a hammer V0 is obtained, the spring constant of concrete surface can be measured. However, in case of collision between an elastic body with flat surface and an elastic body with spherical surface, the maximum impact force becomes proportional to the impact velocity to the power 1.2 based on the contact mechanics. Therefore, velocity correction should be considered as K = 1/M * (Fmax/V01.2)2 (equation 6).
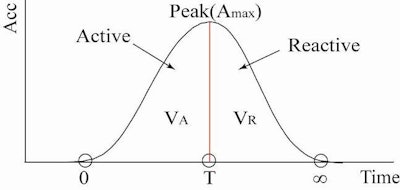 Figure 2: Waveform of impact force.Nitto Construction Inc.
| Fmax = MAmax | } |
| VR = ∫∞T A(t)dt |
In the above, A is an acceleration and max is a subscript that shows the maximum value.
At the actual calculation, velocity is calculated from the waveform, and the waveform is divided in 2 part at the time T when the impact force is the maximum. Deformation of concrete surface becomes maximum at the time T, and the motion of hammer stops. In other words, the first half of the waveform shows the process of deformation of concrete by hammer impact (Active side), and the second half of the waveform shows the process of transferring kinetic energy of elastic deformation of concrete to the hammer (Reactive side).
In case the condition of concrete surface is degraded, concrete surface deforms elastically after plastic deformation of degraded layer occurs. During the reactive process, only kinetic energy of elastic deformation affects to the rebound process of the hammer. In other words, it is considered that active side includes energy loss of kinetic energy caused by the plastic deformation of concrete surface. Therefore, velocity VR is used in the equation (7).
Editor's Note: Formulas have been formatted as best possible for online purposes.
Estimation of Compressive Strength by Degree of Spring Constant
Young’s Modulus and Strain of Concrete
As mentioned in the previous paragraph, the measurement principle of mechanical impedance method is to calculate spring constant of concrete surface. Although the calculated spring constant is equivalent to the modulus of elasticity of concrete, compressive strength of concrete is evaluated at breakdown strength. Thus, compressive strength of concrete should be estimated by spring constant. The idea and estimation procedure are shown as followings.
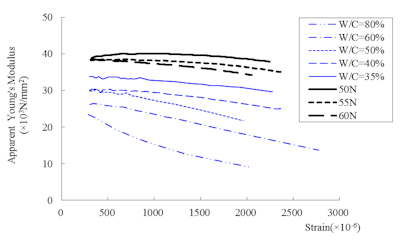 Figure 3: Relationship between strain amount and apparent Young’s modulus.
Figure 3 shows the relationship between strain amount and apparent Young’s modulus based on the stress-strain curve measured by eight different strength of concrete test pieces. The blue line in the figure shows the results of normal strength concrete (shown in W/C ratio), and the black line shows the results of high-strength concrete (shown in designed strength).
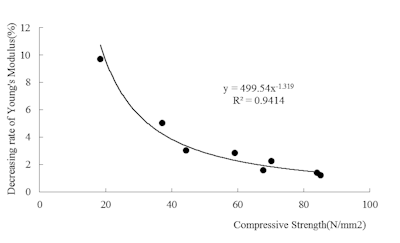 Figure 4: Relationship between compressive strength and reduction rate of Young’s modulus.
Relations of Young's Modulus and Compressive Strength
As mentioned above, apparent Young’s modulus decreases when the amount of strain increases, and the reduction rate of Young’s modulus is influenced by the compressive strength. This fact indicates that estimated compressive strength may include some error depending on the degree of stress that generated by hammer impact in case of estimation by spring constant. Figure 5 shows the relationship between apparent Young’s modulus and compressive strength at 100, 1000 and 2000 micro strain. The relationship between apparent Young’s modulus and compressive strength at each strain amount is shown as liner regression. As the result, R2 values at each strain amount are more than 0.9, and R2 value becomes higher when the strain amount becomes larger.
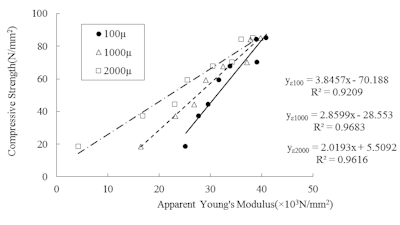 Figure 5: Relationship between apparent Young’s modulus and compressive strength.
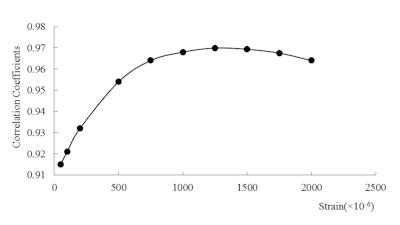 Figure 6: Relationship between correlation coefficient and strain amount.
Mechanical Impedance and Young's Modulus
As confirmed in the previous paragraph, Young’s modulus and compressive strength have significant relationship, and the Young’s modulus at higher strain amount is more adequate for compressive strength estimation. In other words, if the Young’s modulus can be estimated accurately, it is possible to estimate the compressive strength. In this paragraph, possibility of estimation of Young’s modulus by mechanical impedance (spring constant) of concrete surface is discussed. In addition, strain amount that generated by hammer impact is discussed.
The stress σ of concrete surface during deformation process by hammer impact is, σ = Eε = ρcv (equation 8).
Here, E: Young’s modulus, ρ: Density of concrete, c: Velocity of P-wave in concrete, and v: velocity of hammer impact.
In equation 8, velocity of P-wave in case not considering Poisson’s ratio is, c = √ (E / ρ) (equation 9).
And strain amount by hammer impact is, ε = v / c (equation 10).
Strain amount can be estimated by the ratio of velocity of P-wave and velocity of hammer impact. Assuming P-wave of concrete is 4000 m/s, 1250 micro strain can be generated by hammer impact with 0.5 m/s. However, hammer impact can generates partial strain at the contact area between a hammer and concrete.
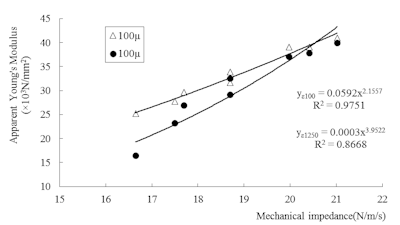 Figure 7: Relationship between mechanical impedance and apparent Young’s modulus.
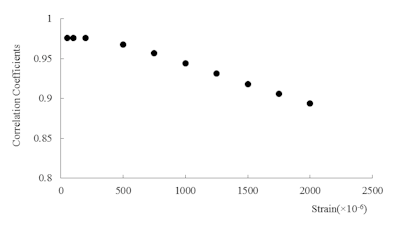 Figure 8: Correlation coefficient of mechanical impedance and apparent Young’s modulus.
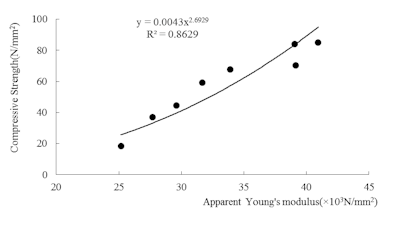 Figure 9: Relationship between apparent Young’s modulus and compressive strength at 100 micro strain.
Figure 9 shows the power trendline between apparent Young’s modulus and compressive strength at 100 micro strain that is shown in figure 5, and significant correlation is confirmed. In other words, compressive strength can be estimated by Young’s modulus. The mechanical impedance method measures mechanical impedance of concrete surface, and estimate the compressive strength by using correlation with Young’s modulus. As shown in figure 7, major estimation error will not occur during the process of estimating Young’s modulus from measured mechanical impedance, but the process of estimating compressive strength from Young’s modulus may cause estimation error.
Mechanical Impedance and Compressive Strength
Figure 10 shows relationship between mechanical impedance and compressive strength, and exponent of the regression curve is 5.8 because Young’s modulus is 2.16 power of mechanical impedance, and compressive strength is 2.69 power of Young’s modulus as shown in figure 7 and 9. Here, the exponent becomes larger since the strain-rate dependence of Young’s modulus becomes higher when the compressive strength is lower.
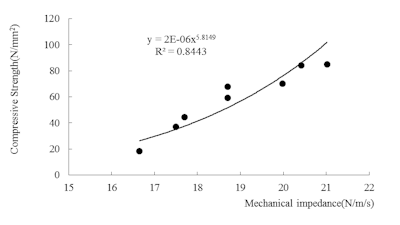 Figure 10: Relationship between mechanical impedance and compressive strength.
It is possible to estimate the compressive strength of concrete from the relationship shown in figure 10. However, we have proposed to apply spring constant of concrete surface which is equivalent to the mechanical impedance value to the third power because the fluctuation of mechanical impedance is smaller comparing to compressive strength, and the relationship between compressive strength and mechanical impedance value to the third power can be shown as liner regression with no intercept. In fact, the range of compressive strength is 20 to 80 N/mm2, and the coefficient of variation is 40.2%. On the other hand, the range of mechanical impedance value is about 17 to 21, and the coefficient of variation is 8.1%. Therefore, small measurement error of mechanical impedance may cause large estimation error.
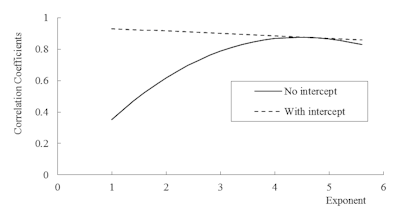 Figure 11: Relationship between exponent and correlation coefficient.
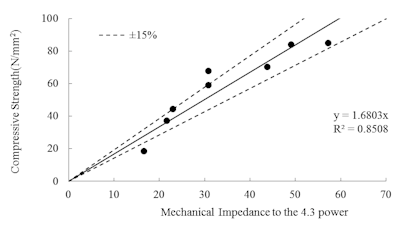 Figure 12: Relationship between mechanical impedance to the 4.3 power and compressive strength.
Conclusion
Compressive strength of concrete is a destructive strength, and there is no direct relationship between measured values based on Young’s modulus. However, from the viewpoint of non-destructive test, it is ideal to develop an index value which has strong correlation with compressive strength. This study reviewed applicability of mechanical impedance method for the estimation of compressive strength by using concrete test pieces, and followings are confirmed.
- Mechanical impedance measures spring constant of concrete surface, and Young’s modulus can be estimated at enough accuracy.
- As the result of compression test with concrete test pieces, the maximum strain amount is within a certain range, and Young’s modulus is depending on the strain amount regardless of the compressive strength. Therefore, estimation of compressive strength is possible once Young’s modulus can be measured with satisfactory accuracy.
- Measurement error occurs during the process of estimating compressive strength from Young’s modulus rather than the process of estimating Young’s modulus from mechanical impedance. In terms of the relationship between Young’s modulus and compressive strength, correlation becomes higher when the strain amount is higher. On the other hand, correlation between mechanical impedance and Young’s modulus becomes higher when the strain amount is lower. In addition, the strain amount which is generated by hammer impact is small.
- Strain-rate dependence of Young’s modulus should be considered in order to estimate Young’s modulus by mechanical impedance with higher accuracy.
- Estimation error of compressive strength of concrete by mechanical impedance method is about ±15%.


