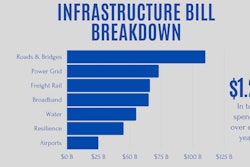
 Click on this image to enlarge it.American Road & Transportation Builders Association
SB1 incrementally raises the fuel excise tax each year to help fund road and bridge repairs. It is an overall 51.1 cents per gallon as of July 1st 2021, making California's total state taxes and other charges on gasoline the highest in the country. Since SB1’s passage in 2017, California’s gas tax has increased by 21 cents.
The investment in their infrastructure is paying off for the state - and not just in the form of better roadways. According to a new report, Economic Impacts of Highway, Street, Bridge, & Transit Investment in California, the construction, maintenance and operation of California’s highway, street, bridge and transit infrastructure is a major economic driver that will support an average of $200 billion in annual economic output, earnings, tax revenue and user benefits over the next decade.
This provides a return of $4.30 for every $1 spent on the system. Every $1 billion spent supports over 15,000 jobs throughout the economy. Total investment will support an average of 700,000 jobs each year and contribute $52 billion annually to California’s Gross State Product (GSP), accounting for nearly 2 percent of total economic activity. The report proves that the construction, maintenance and operation of California’s highways, streets, bridges and transit infrastructure are major economic drivers benefiting every sector of the economy.
Other Findings From the Report
Total highway, street, bridge, and transit investment in California is expected to grow from $40.4 billion in 2021 to $52.6 billion in 2030, not including any additional spending included in the 2021 federal infrastructure bill being negotiated in Congress. This includes revenues from federal, state and local government sources to spend on capital outlays, maintenance, system improvements and operations.
Based on the expected mix of capital projects and operations, the benefits of state highway, street, bridge and transit investments include:
- Sales and revenue by state businesses of nearly $101.5 billion each year, totaling $1 trillion over 10 years. This is across all sectors of the economy.
- This will support an average of 700,000 jobs each year, with growing investment over the next decade adding over 200,000 new jobs.
- Those workers will earn an average of $30.3 billion per year, resulting in $303 billion in additional earnings over 10 years.
- These earnings are part of the $52 billion per year value-added that these businesses contribute to the state GSP, accounting for 2 percent of the state total.
- Federal, state, and local government tax revenue from the economic activity will average $21.2 billion per year, for a total of $212.2 billion over the decade. This includes estimated revenues from individual income, business, corporate, and sales and use taxes.
You can read the full report here.

