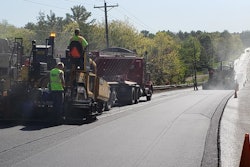
On Oct. 17, the Congressional Budget Office (CBO) issued two reports detailing public spending and financing tools on transportation and water infrastructure from 1956 to 2017. The reports provide information on six types of infrastructure: highways, mass transit and rail, aviation, water transportation, water resources, and water utilities.
The CBO infrastructure spending report showed that public spending on transportation and water infrastructure has been fairly consistent as a share of gross domestic product at about 2.3%, which is below the 3.0% peak in 1959.
CBO’s infrastructure finance report illustrates that more than half of state and local spending on transportation and water infrastructure has been financed through bonds that provide federal tax preferences or through federally supported loan programs.
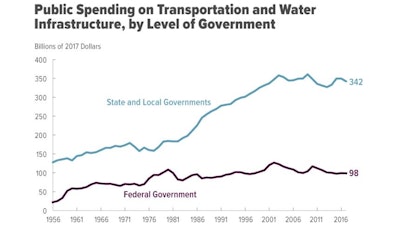
Public spending – federal, state, and local governments – on transportation and water infrastructure totaled $440 billion in 2017. The majority of that spending came from state and local governments, providing $342 billion, while the federal government accounted for $98 billion.
Of the state and local government spending, 30% was for capital expenditures and 70% was for operation and maintenance. While most federal spending – 73% – went towards capital expenditures and 27% went to operations and maintenance.