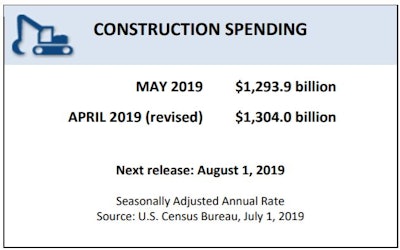
The U.S. Census Bureau announced the following value put in place construction statistics for May 2019.
Total construction spending during May 2019 was estimated at a seasonally adjusted annual rate of $1,293.9 billion, 0.8% (±1.2%) below the revised April estimate of $1,304.0 billion. The May figure is 2.3% (±1.5%) below the May 2018 estimate of $1,324.3 billion.
During the first five months of this year, construction spending amounted to $498.8 billion, 0.3% (±1.3%) below the $500.3 billion for the same period in 2018.
Spending on private construction was at a seasonally adjusted annual rate of $953.2 billion, 0.7% (±0.7%) below the revised April estimate of $960.3 billion. Residential construction was at a seasonally adjusted annual rate of $498.9 billion in May, 0.6% (±1.3%) below the revised April estimate of $501.7 billion.
Nonresidential construction was at a seasonally adjusted annual rate of $454.3 billion in May, 0.9% (±0.7%) below the revised April estimate of $458.5 billion. Spending gains in areas such as transportation (+4%) and construction (+1.3%) were offset by declines in a number of segments, including religion (-5.5), commercial (-3.3%) and highway and street (-3.4%).
In May, the estimated seasonally adjusted annual rate of public construction spending was $340.6 billion, 0.9% (±2.1%) below the revised April estimate of $343.7 billion. Educational construction was at a seasonally adjusted annual rate of $79.3 billion, nearly the same as (±2.6%) the revised April estimate of $79.3 billion. Highway construction was at a seasonally adjusted annual rate of $111.6 billion, 3.2% (±6.1%) below the revised April estimate of $115.4 billion.
On a year-over-year basis, private construction for May was 6.3% below May 2018, with residential spending down 11.2% and nonresidential up 4.4%. Nonresidential spending was led by double-digit gains in several segments, including sewage and waste disposal (+19.0%), manufacturing (+13.4%), highway and street (+17.1%) and transportation (+13.1). Public construction spending leapt 10.8% year-over-year, led by a 17.9% gain in transportation, 14.0% increase in manufacturing and 9.3% increase for new multifamily.
Click here for full details and data.
The June 2019 Monthly Construction Spending Report is scheduled for release on August 1, 2019.