The 2021 Top Contractor results are in and the numbers show a decrease in sales from last year and there could be multiple reasons why we saw lower profits and sales.
This can be because of the COVID-19 pandemic blanketing the nation starting in mid-March 2020. However, the survey shows contractors in the pavement maintenance industry were still out completing jobs for their customers, which we can assume the industry workers were deemed essential.
Also, this year we assembled a list of 75 contractors per industry segment compared to last year where we had 50 companies per list. The 2021 Top Contractor List total sales, dropped significantly even with the increase of 25 contractors who qualified for the list, showing the industry took a hard hit in sales for year 2020.
Here is an overview of the Paving 75, Sealcoating 75, Striping 75 and Pavement Repair 75 for 2021 - along with industry insights resulting from the information these companies provide.
Overall Sales Dollars
We start with overall sales dollar of the qualifying contractors which reached more than $1.096 billion. That compares to $1.316 billion last year and $1.055 billion in 2019.
That overall sales number represents the combined total of only paving-only, sealcoating-only, striping-only, and repair-only sales – in other words the sales figures used to compile our four lists. No sales dollars are duplicated, and any sales relegated to the “Other” sales category also are not included.
All lists saw a slight decrease in total sales of all work completed despite having more contractors apply and qualify for this years lists.
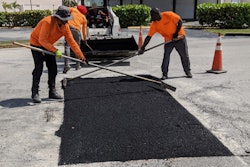
- Paving 75: $1.336 billion total sales compared to $1.611 billion last year
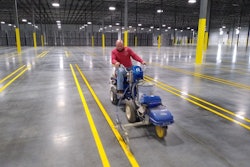
- Striping 75: $890 million total sales compared to $1.536 billion last year
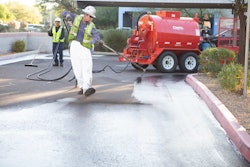
- Sealcoating 75: $930 million total sales compared to $1.271 billion last year
- Pavement Repair 75: $1.061 billion total sales compared to $1.360 billion last year
There was also a decrease in segment-only sales for all four segments as well.
- Paving-only sales dropped to $681,489,281 from $832 million last year
- Striping-only sales dropped significantly to $99,558,369 from $204 million last year
- Sealcoating-only sales dropped to $108,935,864 from $161 million last year
- Pavement Repair-only sales dropped $206,222,646 from $217 million last year
If we look back at last years list, the sales volume of contractors took a huge leap as large contractors were joining the list. Also, sales in 2019 (which would've made up the 2020 Top Contractor Lists) were in part because of a good economy. 2020 sales (which is the base for the 2021 Top Contractors List) might have been down due to economic uncertainty the coronavirus pandemic had on the nation. We can speculate that customers were hesitant to spend large amounts of money to have their pavements replaced. It would make sense that the pavement repair segment did not see a huge drop because customers might have felt more comfortable having repair work done rather than a whole mill and fill job.
The "Average" Top 75 Contractor
Taking into account all the companies participating in this year's survey, the average contractor generates just over $14 million in annual sales ($22 million last year and $14 million in 2019) from a diversified mix of paving and pavement maintenance work. The average revenue by segment breaks down this way:
- Paving: 59% (33% last year)
- Sealcoating: 24% (21%)
- Striping: 19% (18%)
- Pavement Repair: 18% (14%)
- Sweeping: 4% (3%)
- Other: 11% (11%)
Concrete work is the most-common service cited in the "other" category, which also includes surface treatments, hot mix asphalt production, drainage, traffic control, landscaping or snow removal and sports courts.
The average company works 68% of its time on parking lots, 26% on streets, 19% on driveways, 19% on highways and 8% on other (paths, courts, signage, concrete flatwork).
As for the customers this average contractor works for:
- 55% are commercial clients
- 22% are municipal (state/local agency) customers
- 22% are multi-family properties
- 18% are single family homeowners
- 8% is "other" which is a mix of general contractor, sports courts, paths and farms
The average contractor generates 22% of revenue (21% last year) from work as a subcontractor.
Other Findings
Overall Profit Margins - We’ll report profit margins for each industry segment in the introduction to each segment on the following pages, but the chart on this page provides a look at the overall range of profit margins for all companies responding to the survey, whether they qualified for a list or not.
As the chart shows, there continues to be a broad range of profit margins with which contractors are working. This holds true for each of the industry segments as well, however we did see a slight drop in margins in this years segmented list compared to last year. It is clear that the 2020 profit margin results reinforce the trend that margins continue to move in the right direction.
- 4% of respondents indicated they earn less than 3% margin (1% last two years)
- 1% reported margins in the 3%-5% range (7% 2020, 3% in 2019)
- 25% report margins in the 5%-10% range (16% in 2020 and 17% for 2019 list sales)
- 20% of respondents indicated they earn 10%-15% profit margin (32% last year, 33% in 2019)
- 50% report margins greater than 15% (45% in 2020 and 46% in 2019)
Replacement Value of Equipment - While the pavement maintenance business has been viewed as an industry with a low-cost barrier to entry, particularly in the sealcoating, striping and possibly repair segments (though few contractors start out as “repair specialists”), the contractors that make up these lists have significant investments in their fleets. Survey results indicate that:
- 10% could replace their fleet for less than $250,000
- 10% for between $250,000-$500,000
- 11% for between $500,000-$1 million
- 25% for between $1 million-$2 million
- 44% for more than $2 million
Number of Jobs - Despite the global pandemic that started in 2020, contractors were out completing many jobs. This is evident that those completing this work were deemed "essential workers" and conduct a range of operations and services that are typically essential to continue critical infrastructure operations. The 2020 numbers were slightly higher in the "perform less than 100 jobs" category (10% reported last year) however, the survey results prove that contractors were busy in 2020.
- 15% perform less than 100 jobs
- 15% perform between 101-150 jobs
- 9% perform between 151-200 jobs
- 13% perform 201-300 jobs
- 8% perform 301-400 jobs
- 40% perform more than 400 jobs
Number of Customers. The number of customers contractors perform those job for indicates they often obtain multiple projects from the same customer – a good sign for those pursuing relationship-building as a means of growth.This might also mean that one contractor can complete a wide variety of services for that one customer, diversifying their operation to become a "one-stop shop". Over half (56%) work for fewer than 200 customers, while 19% work for more than 400 customers.
- 30% work for fewer than 100 customers
- 17% work for between 101-150 customers
- 9% work for 151-200 customers
- 15% work for 201-300 customers
- 7% work for 301-400 customers
- 19% work for more than 400 customers
Number-crunching assistant, Nick Raether, AC Business Media Digital Operations Manager