You get the job at a good price. You keep an eye on your weekly job costs. Everything seems to be on course for a profitable conclusion...and then it all falls apart at the end.
Jobs rarely turn bad at the end. They start going south much earlier than that. You just don't notice they've gone south until your budget runs out.
Most projects deteriorate so slowly, nothing grabs your attention. Nothing screams "We've got a problem here!"
As you've discovered, once the end is in sight, it is too late to save a job from impending doom.
As substantial completion nears, your crews begin falling all over themselves to finish on time. Errors mount. Your punch list taunts and haunts you. Your labor costs skyrocket, blowing right through your budget.
Wouldn't you like to have an early warning system that tells you when to take corrective action now, before it's too late? With a little effort you can build yourself just such a system.
Severe storm warning systems rely on doppler radar. Your system is going to rely on man-hours and construction materials. Instead of seeing blips and clouds on a screen, you are going to see tables and graphs.
Here's how to build your very own early warning system.
Step 1
Identify the one to three primary materials that best reflect the nature of your work. For example: square feet of concrete slabs for concrete flat work contractors.
Step 2
Determine the average amount of work per man-hour (material quantity per man-hour) that the job was budgeted for.
Step 3
Create a table that shows:
- Man-hours used-to-date,
- Material quantity installed-to-date,
- Average material quantity per man-hour used-to-date,
- Total material quantity budgeted,
- Percent of material installed,
- Projected man-hours needed to complete the job at current pace,
- Man-hours budgeted, and
- Variance from budgeted and projected man-hours.
Step 4
Modify your time sheets to track the amount of material installed each day to collect the needed data.
Step 5
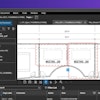
Each week, print a graph that shows the budgeted quantity per man-hour for the job, each week's performance, and the running average to date.
(Send me an e-mail if you would like to see an example.)
Keep a close eye on this labor productivity graph. If the weekly performance stays below the budgeted average, the job is going to come in considerably over budget.
It's that simple.
If your project is heading for a disastrous result, this type of graph will reveal that impending doom before the job is 20% done. No more waiting until 90% completion before discovering your labor costs are going to blow your budget.
You and your foreman will have plenty of time to create solutions to save the project. If you can't, somebody must have blown the bid or agreed to work for the wrong client.