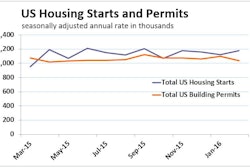
February's U.S. construction starts level, excluding residential work, was $19.1 billion, according to CMD. That is a 22.2% drop compared to January 2016. The long-term average decline in starts from January to February, due to inclement winter weather, has been -2.5%.
It should be noted, though, that January starts of this year compared with December of last year were 7.1%. There is an usual contraction between those two months, due to seasonality, of -8.5%. It would seem that, this year, January's normal seasonal pullback was delayed until February.
Compared with February or 2015, the latest month's starts level was a less severe -5.1%. Compared with average nonresidential starts in February over the past five years, 2011 to 2015 inclusive, the decline was -8.5%. Year-to-date starts, though, are a more buoyant 3.7%.
Nonresidential building plus engineering/civil work accounts for a considerably larger share of total construction than residential activity. The former's combined proportion of total put-in-place construction in the Census Bureau's January report was 62%; the latter's was 38%.
The latest Employment Situation Report from the Bureau of Labor Statistics (BLS) records a 19,000 gain (seasonally adjusted) in the total number of construction jobs in February. This was a slight improvement from 15,000 in January. The average monthly uptick this year (17,000), however, has fallen short of the performance in the first two months of last year (39,000).
Year-over-year employment in construction in February rose at a 4% rate — that was more than double what was recorded for all jobs, 1.9%. The sector also compared favorably with manufacturing (0.1%), government (0.3%), retail (2.2%), leisure and hospitality (3%), professional and business services (3.1%) and education and health (3.2%). The jobless rate in construction in February was 8.7%, down from 10.6% a year ago and 12.8% two years prior.
Total jobs in architectural and engineering services in February were 0.4% month to month and a quite respectable 3% year over year. A further gain of just 1% will return them to their pre-Great Recession peak.
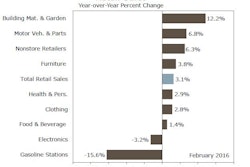
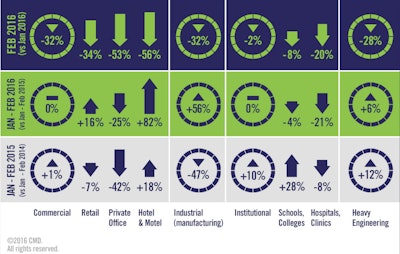
Month-to-month starts in the commercial (-32.2%) and heavy engineering (-28.4%) type-of-structure categories were disappointing in February. Industrial/manufacturing starts also suffered a major retreat (-31.8%), but they can swing wildly from on month to the next based on whether or not ther eis a go-ahead for a mega project. Institutional (-2.2%) was almost even.
Comparing standalone February 2016 starts results with the same month in 2015, the percent changes were less bleak. Commercial was weakest (-15%) followed by heavy engineering (-7.9%), but institutional was flat (0.4%) and industrial was considerably better (299.3%).
The year-to-date results were led higher by heavy engineering/civil (5.9%) as commercial (0.4%) and institutional (-0.2) stayed unchanged. Industrial, though, was improved (56.1%).
At 45% of the total, road/highway work was the dominant subcategory within engineering, and it was -38.4% month to month (m/m) and -4.9% year over year (y/y) but 17% year to date (ytd).
Second largest was water/sewage work for which starts were -17.2% m/m, 12.4% y/y and 10.1% ytd.
The also big category of bridges was -41% m/m, -40.8% y/y and -2.9% ytd.
The largest subsets in commercial were:
- Retail/shopping (-34.2% m/m, -19.6% y/y, 15.6% ytd)
- Hotel/motel (-55.9% m/m, 26.3% y/y, 81.9% ytd)
- Private offices (-53.3% m/m, -38.2% y/y, -24.6 ytd)
- Government offices (-28.2% m/m, 35.5% y/y, 53% ytd)
On an upbeat note, warehouses was uniformly positive (3.9% m/m, 19.9% y/y and 9.1% ytd).
More than half of institutional project starts have been provided by the school/college subcategory so far this year, and in February it was -7.7% m/m, -13.5% y/y and -4% ytd.
Second most important for institutional is hospital/clinic starts at -19.9% m/m, -9.2% y/y and -21.1% ytd.
The most surprising subcategory within institutional so far this year has been military with 63.2% m/m, 1,372% y/y and 411% ytd.
Nursing/assisted living project starts had a good individual month of February at 55.4% m/m and 35.1% y/y, but it was -6.9% ytd.
Across all structure types, there were three subcategories that performed much better in the second month of 2016 than on average during February of the previous five years:
- Hotels/motels, 45%
- Warehouses, 39.7%
- Nursing/assisted living, 59.6%
There was another subcategory that continued to underwhelm, hospitals/clinics (-27%)
The 'Top 10' projects for the month add to only slightly more than $1 billion. In many other months there have been one or two individual projects of a billion dollars or more each, usually termed mega projects. In February, Texas stood out for contributing three of the Top 10 projects.
February's top 10 construction project starts:
- US Navy Electronic Science & Technology Laboratory, Washington, D.C.
- Cortina at Boynton Village, Florida
- IKEA Distribution Center, Illinois
- Center Hill Auxiliary Dam Berm & Left Ri, Tennessee
- University Flats Student Housing, Kentucky
- Central Nebraska Veterans Home, Nebraska
- Dallas Various Storm Drainage Tunnels, Texas
- Stallion Point Apartments, Texas
- Reserve at Quebec Apartments, Texas
- Los Angeles International Airport Runway 7L 25R Safety, California
The economy-wide unemployment rate in February stayed the same as in January, at a fairly tight 4.9%. Year-over-year compensation increases remained restrained, however. For all workers, including supervisory personnel, year-over-year earnings were 2.2% hourly and 1.6% weekly. The comparable figures for construction were 2.4% and 2.1%.
Excluding bosses, the year-over-year economy-wide wage gains were 2.4% hourly and 2% weekly. Construction employees fared a little better at 2.9% and 2.1% respectively.
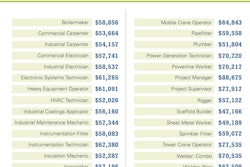
Despite Labor Shortage Construction Industry Salaries Remain High
The starts figures throughout CMD's report are not seasonally adjusted (NSA). Nor are they altered for inflation. They are expressed in what are termed 'current' as opposed to 'constant' dollars.
CMD's nonresidential construction starts series, because it is comprised of total-value estimates for individual projects — some of which are ultra-large, has a history of being more volatile than many other leading indicators for the economy.