A slight improvement in business conditions has led to fewer architecture firms reporting declining billings, according to a new report from The American Institute of Architects (AIA).
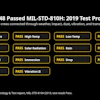
AIA’s Architecture Billings Index (ABI) score for January was 44.9* compared to 42.3 in December (any score below 50 indicates a decline in firm billings). Last month’s score indicates overall revenue at U.S architecture firms continued to decline from December to January; however, the pace of decline slowed. Inquiries into new projects during January grew for the second month in a row, with a score of 56.8 compared to 51.7 in December. The value of new design contracts also reflected an easing in the pace of decline, rising to a score of 48.8 in January from 47.0 the previous month.
“The broader economy entered a soft spot during the fourth quarter of last year, and business conditions at design firms have reflected this general slowdown,” said AIA Chief Economist, Kermit Baker, Hon. AIA, PhD. “While federal stimulus and the increasing pace of vaccinations may begin to accelerate progress in the coming months, the year has gotten off to a slow start, with architecture firms in all regions of the country and in all specializations reporting continued declines in project billings.”
Key ABI highlights for January include:
- Regional averages: South (47.4); West (42.8); Midwest (42.2); Northeast (41.9)
- Sector index breakdown: mixed practice (47.9); multi-family residential (44.4); commercial/industrial (44.3); institutional (39.9)
- Project inquiries index: 56.8
- Design contracts index: 48.8
The regional and sector categories are calculated as a three-month moving average, whereas the national index, design contracts and inquiries are monthly numbers. To learn more about recent economic developments impacting design and construction, visit AIA’s website.
*Every January the AIA research department updates the seasonal factors used to calculate the ABI, resulting in a revision of recent ABI values.