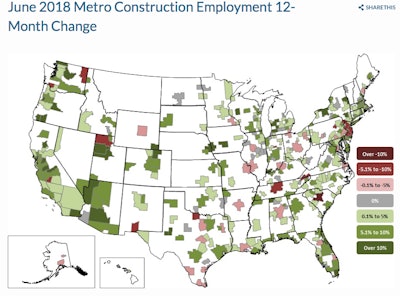
Construction employment increased in 272 (76%) out of 358 metro areas between June 2017 and June 2018, declined in 44 (12%) and was unchanged in 42, according to a new Associated General Contractors of America analysis of federal employment data. Association officials noted that, for now at least, the growing economy and strong demand for construction services appear to be offsetting cost increases caused by significant labor shortages and newly-imposed trade tariffs.
“Increases in construction employment in the past year were widespread and strong, as employment increased in three-fourths of metro areas,” said Ken Simonson, the association’s chief economist. “Workers in most metro areas are benefitting as firms keep pace with strong demand for construction services.”
Simonson noted that more metro areas added construction jobs in the past year than in any 12-month period since February 2015. The economist added that 64 metro areas set new construction employment highs for June, including San Jose-Sunnyvale-Santa Clara, Calif., where the previous high for June was set in 2001, and Midland, Texas, which exceeded its previous June peak by 20%.
The Houston-The Woodlands-Sugar Land, Texas metro area added the most construction jobs during the past year (19,300 jobs, 9%), followed by:
- Phoenix-Mesa-Scottsdale, Ariz. (13,100 jobs, 11%)
- Dallas-Plano-Irving, Texas (12,200 jobs, 9%)
- Atlanta-Sandy Springs-Roswell, Ga. (8,400 jobs, 7%)
- New York City (8,300 jobs, 5%)
The largest percentage gain occurred in Merced, Calif. (700 jobs, 28%), followed by:
- Midland, Texas (6,700 jobs, 24%)
- Weirton-Steubenville, W.Va.-Ohio (19%, 300 jobs)
- New Bedford, Mass. (18%, 500 jobs)
- Leominster-Gardner, Mass. (18%, 400 jobs)
The largest job losses from June 2017 to June 2018 were in Middlesex-Monmouth-Ocean, N.J. (-3,400 jobs, -8%), followed by:
- Newark, N.J.-Pa. (-2,800 jobs, -6%)
- Nashville-Davidson--Murfreesboro--Franklin, Tenn. (-2,300 jobs, -5%)
- Columbia, S.C. (-2,100 jobs, -10%)
- St. Louis, Mo.-Ill. (-1,800 jobs, -3%)
The largest percentage decreases — 10% each — occurred in Columbia, S.C., and Hanford-Corcoran, Calif. (-100 jobs), followed by:
- Middlesex-Monmouth-Ocean, N.J.
- Kokomo, Ind. (-8%, -100 jobs)
- Bloomsburg-Berwick, Pa. (-8%, -100 jobs)
Association officials said strong economic growth, buoyed in part by lower tax rates and regulatory reforms, were helping drive demand for new construction projects in most parts of the country. Economic growth also appears to be offsetting the impacts of labor shortages and rising materials prices caused by trade tariffs for many construction firms, they added. But they cautioned that the benefits could be short-lived if materials costs continue to increase and labor becomes even more scarce.
“Tax and regulatory reform are helping put a lot of people into high-paying construction jobs across the country,” said Stephen E. Sandherr, the association’s chief executive officer. “Finding ways to quickly resolve trade disputes and encourage more people to work in construction will help put even more people to work.”
View the metro employment data rankings, top 10, history and map.