
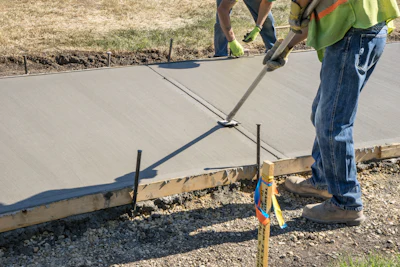
A standard concrete sidewalk placement bids at $4.96 per square foot at the low end in Austin. It's $16.88 at the low end in New York City. Same class of pay item, both figures adjusted to current dollars, and a 3.4x spread between them.
Neither number came from a survey, a cost book, or a contractor's estimate. Both came out of public bid tabulations — the documents every state transportation department publishes showing what contractors actually bid to win government work. That data is free, it is primary, and most estimators in this trade never open it. It is worth 20 minutes the next time you are trying to work out whether a flatwork number is sane.
What is a Bid Tabulation, Actually
When a DOT lets a contract, bidders submit unit prices against a schedule of pay items: so many square yards of concrete sidewalk, so many cubic yards of structural concrete, so many linear feet of curb and gutter. After the letting, the agency publishes the tabulation — every bidder, every unit price, the engineer's estimate, and who won.
It is the closest thing this industry has to a public record of what concrete costs.
That is a contract price, not an opinion. Somebody signed their name to it and built the work. It is the closest thing this industry has to a public record of what concrete costs, and every state transportation department publishes some version of it.
Most agencies go further and publish an average-unit-price summary — a rolled up table of what each pay item has been bidding at across recent lettings. That summary is usually where you want to start. There are four that are open, current, and take no login.
- Caltrans publishes a Contract Cost Data search at sv08data.dot.ca.gov/contractcost/, queryable by item code and date range.
- Colorado DOT posts bid tab archives at codot.gov/business/bidding/bid-tab-archives, and also compiles an annual cost data book covering the same items
- Minnesota DOT publishes awarded-job abstracts and average bid prices at dot.state.mn.us/bidlet/abstract.html
- New York State DOT posts construction contract documents and results under dot.ny.gov/doing-business/opportunities/const-notices
For the other states, the pattern holds: search the agency name plus "bid tabulations" or "average unit prices." Florida, Texas, North Carolina, Illinois, and Georgia all publish equivalents. A few make you work — some sit behind a procurement portal, some publish only PDFs of individual lettings, and Arizona does not offer a bulk export at all. The majority hand you a spreadsheet.
Editor's Note: If you know of other open and active online summaries, please email us at [email protected].
Finding the Right Pay Item
This is where most people give up, and it is the part worth being patient with.
You are not looking for "concrete." You are looking for the flatwork placement item, usually described as concrete sidewalk, and usually priced by the square yard rather than the square foot. Then, divide by nine to convert the result to square yardage.
Caltrans prices its minor concrete item by the cubic yard, not the square yard, so California is the one state where that conversion does not apply.
Two cautions. First, some agencies split the item by thickness — a 4-in. sidewalk and a 6-in. sidewalk carry different codes. Mixing them will unnecessarily widen your range. Second, curb and gutter and driveway aprons are separate items in nearly every schedule; do not sweep them into the same average.
I use sidewalk placement as the baseline because it maps more cleanly onto the same underlying work across state lines than any other flatwork item. Driveways, patios, and slabs on grade all carry site-specific variables that the DOT schedule does not describe.
Bringing an old Letting Into Current Dollars
A 2021 unit price is not a 2026 unit price, and the gap is larger than people expect.
The WPU1333 tracks the material, not the labor, so treat it as a floor on the correction rather than a complete one.
The Bureau of Labor Statistics publishes a producer price index specifically for ready-mix concrete, series WPU1333, at data.bls.gov/timeseries/WPU1333. Pull the index value for the month of the letting and for the most recent month, divide the second by the first, and multiply the old bid price by the result. That gives you the same job in today's dollars.
Here's an example to show a sense of scale. To reach 2025 dollars, a 2021 Georgia letting needs roughly a 31 percent adjustment. If you are comparing a 2021 bid against a quote you got last week without adjusting, you would be off by close to a third before you start
Both factors come from BLS series WPU1333: divide the index for the most recent month by the index for the year of the letting. The series is at data.bls.gov/timeseries/WPU1333. The current value moves every month. Contractors are welcome to run it for the letting year of their interest.
Understand that the WPU1333 tracks the material, not the labor, so treat it as a floor on the correction rather than a complete one.
What the Number Does Not Include
Here is where a DOT unit price will mislead you if you take it at face value. This is the paragraph I would most want a reader to keep.
DOT pours are large-volume infrastructure placements. A contractor bidding 2,000 sq. yd. of sidewalk across a corridor project amortizes mobilization, formwork, and finishing crews over a quantity no residential job approaches. A 400 sq. ft. patio does not get that price and never will. Minimum mobilization dominates small pours, so a small job prices above the low end of any DOT-derived range. Often, well above it.
Some DOT contracts also carry prevailing-wage or project-labor requirements that run above typical private rates, which pushes in the other direction. And the schedule assumes a prepared subgrade delivered by somebody else on the project; your quote probably does not.
A bid tab tells you what the concrete work is worth in your market, at scale, under public-works conditions. It gives you a defensible floor and a sense of regional level. It does not give you a bid.
Reading your own Market
The reason to do this at all is that the regional spread is far wider than the flat multipliers most estimating references apply.
If you are applying a single national adjustment factor to a cost book, that is the error you are carrying.
Compiling distinct unit-bid records — 617 metro-level assignments, since three statewide pools each back more than one metro — drawn from state DOT agencies plus New York City's Department of Design and Construction, across 30 metros, the median professional installed price for that sidewalk placement comes to $11.07 per square foot, and the full band across the 29 DOT-backed metros runs $4.96 to $38.00.
Split by climate, the pattern is blunt: the ten Sun Belt metros average $8.48 per square foot against $13.54 for the 11 northern and coastal ones (59.7 percent higher). Frost-depth footings, prevailing-wage labor markets and a shorter pouring season are doing that work. If you are applying a single national adjustment factor to a cost book, that is the error you are carrying.
I should be straight about the limits of my own compilation, because you would find them anyway. Houston, Dallas, San Antonio and Austin currently carry identical figures, because all four draw on the same statewide TxDOT dashboard rather than metro-specific tabs. Treat intra-Texas comparisons accordingly. Eight of the 30 metros are calibrated from a neighboring jurisdiction's bid data rather than pulled directly. Phoenix is modeled with no DOT source at all, for the export reason above. Those figures come from the SlabCalc Concrete Cost Index, last updated May 15, 2026, and they are published under a Creative Commons Attribution license so anyone can check them against the original tabs.
The Point
You do not need a subscription, a data vendor, or anyone's proprietary index to sanity-check a flatwork number. Your state already published what the work bids for, to the cent, under its own procurement rules.
Open the tabulation, find the sidewalk item, adjust it for inflation, and remember that it describes a scale of work your job probably is not. That is still a better reference point than a national average, and it costs you an afternoon once.