Developed with input from staff at National Center for Asphalt Technology (NCAT) and with consulting advice from the civil engineering department at the University of Arkansas, the RoadBump app from Grimmer Software is an inexpensive tool for pavement contractors, counties and government organizations to get estimated IRI information that previously was available only through very high cost laser profilers.
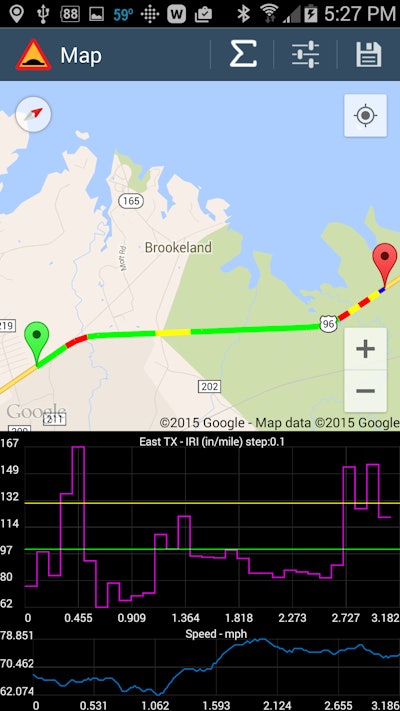
RoadBump uses an Android device’s GPS and accelerometer to measure the roughness of a road. It displays a map of the road that was measured, and graphs estimated IRI for any section of the road.
RoadBump produces estimated IRI graphs as a moving average or in segment lengths that you specify (such as one mile or kilometer). An accelerometer graph shows individual bumps, dips and waves.
“RoadBump’s goals are to provide an extremely low-cost tool to gather roughness data, to pinpoint rough points on a road, and to provide relative comparisons of different roads or the same road over time,” says Dave Grimmer with Grimmer Software.
Tested quality
RoadBump was tested over a 19-mile section of road in central Arkansas—from the intersection of Highway 5 and Highway 64 to the intersection of Highway 5 and Baseline Road.
The state highway department provided left- and right-wheel path IRI results from their ARAN van, which evaluated the same section of road a couple of months before the RoadBump test. The road was driven at the posted speed limit of 55 mph.
Over each of the five sections, RoadBump’s IRI averages were always within 7.3% of the true IRI.
RoadBump’s moving average graph closely matches that produced by the state’s inertial profiler. Comparisons of the other sections show a similar tight fit.
The IRI data from the state of Arkansas was provided at 5-meter intervals. RoadBump generated 50,804 accelerometer records over that same stretch of road, yielding an IRI estimate every 9.6 in. Each series is a moving average covering 570 ft.
Looking at IRI averages for each 0.1 mile for section 7, RoadBump continued to show very good results. The results from section 7 (a 1.4-mile section) are shown in Figure 2 with IRI averages plotted for each 0.1 mile.
Easy operation
RoadBump is designed to be easy to use. Simply press the giant start button, drive the road you want to measure at normal speeds and then press the giant stop button. Road data is gathered and held on the device so a network connection is not required.
When you view a recording, RoadBump displays a Google map of the path traveled along with graphs showing how the roughness varied across the recorded path. Old recordings can be compared one at a time to recent recordings to see relative changes in the roughness of the road.
RoadBump’s data can be exported for use in other applications (such as Microsoft Excel). The app also allows recordings up to two hours in length that can be later saved as smaller segments.
“The greatest benefit of RoadBump is that it provides objective data about the roughness of a road to support the decision making process,” says Grimmer.
RoadBump is available as free and paid versions through the Google Play Store. The free version allows you to verify the app works properly on your device. It allows you to record a path and review the resulting map and graphs.
The paid version, RoadBump Pro, adds in several features, including the ability to save and manage recordings, to move data to a PC, and to save a portion of a recording as a separate recording.
For more information, visit grimmersoftware.com.