SmartPM Technologies has announced the addition of a new Executive Dashboard feature for its cloud-based schedule-analytics and project controls platform.
The Executive Dashboard supports the functionality of SmartPM by providing overall project insights for a company’s entire portfolio of ongoing projects. This is accomplished by aggregating schedule data across a number of mission-critical analytic categories, combining them, and producing a “macro view” - an average of the performance in each category. This insight will help executives identify specific areas that regularly prove to be “project killers,” allowing them to create long-term corrective actions.
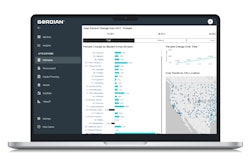
SmartPM’s current dashboard features cumulative project totals, such as Total Projects, Projects Delayed, Projects on Track and Projects That Need New Schedules. The new dashboard incorporates several parameters that compute averages across all projects, such as Average Project Health Index, Average Schedule Quality Index, Average Compression Index, Average SPI and Average Finish Variance. The values in these areas represent a health check of an organization’s entire scheduling process, from schedule creation to project completion.
Michael Pink, CEO of SmartPM Technologies, believes that the new dashboard’s broad perspective will help contractors and builders manage projects.
“Our SmartPM platform has always provided customers with the necessary intelligence to help them improve schedule quality and mitigate risk on individual projects,” said Pink. “Now, our new Executive Dashboard will help company executives get a better sense of how their projects are performing as a whole while identifying repeated problem areas that can’t always be seen by analyzing projects one at a time."
“In the bigger picture, it will help them craft a strategy on how to improve their business and empower them with clear KPIs to ensure they are moving in the right direction," explained Pink.
The dashboard not only gives users access to insights, it can also serve them up according to myriad measurables. The Executive Progress map, for example, lets users cluster projects together by region or country, which might reveal weak spots based on geographics. A CEO might see that all the company’s projects are highly compressed in New York only in January and might surmise that it’s due to winter-weather conditions. But if the compression occurs on a more sporadic timetable, the executive can look in different places for the causes.
A project could also be viewed through one of the more common parameters – date. Finding out which months are strongest and in which ones the majority of the obstacles crop up could be instructive. There is also a geographical “heat map” that can be used to identify hotspots based on quality, compression, performance and other criteria.
Metadata fields can be created for various groupings, such as by specific subcontractor or industry vertical. Data in the Executive Dashboard can be restricted based on titles and responsibilities. While a C-suite executive may be able to view the company’s entire project portfolio, a regional manager could be given access only to the jobs in their region.