When we think about the various tools available to our maintenance team, we often think about physical tools such as a screwdriver, wrench or possibly even a hammer (if used in the right circumstances!). However, we don’t think about some of the methods we could employ which can make our maintenance teams more efficient or our equipment more reliable.
One such method is oil analysis and while it my not be at the forefront of our minds when thinking about increasing the reliability of the fleet, it’s impacts can be very significant once utilized properly. In this article, we will talk about the implementation of oil analysis for a mixed fleet of equipment, the impact of this program and the ways that the success of this method can be measured.
What Is Oil Analysis?
If you’ve ever drained the oil from the sump of a diesel engine, then you would know that it’s a messy process. Typically, when this oil is drained, the mechanic can tell you a few things about what happened on the inside of the engine without going to a lab.
For instance, some mechanics may place a magnet in a sealed bag and drop this into the drained oil. When they remove the bag, if there are metal filings stuck to the outside of the bag with the magnet, then that means there is some significant wear occurring on the inside of the engine. Similarly, if there is a tinge of a rainbow colour on the surface of the drained oil, that could mean that fuel is getting into the oil system and there may be an issue with one of the fuel injectors.
While these methods may not be able to precisely tell us how much fuel or wear (or what type of wear metal was present), they do provide some indications of what’s happening on the inside of the equipment. This is where oil analysis can be the game changer for our mechanics and our teams leading the reliability initiative.
With oil analysis, we can accurately and quantitatively trend the presence or absence of certain characteristics of the oil and what it contains. In this instance, we are able to correctly identify the wear metals present in the oil and trend whether these values increase or decrease over time. This can help our mechanics to figure out exactly where the wear is coming from as they would be able to identify the parts of the engine which are associated with the increase in the particular wear metal from the report.
Additionally, they can become more aware of other important parameters such as viscosity or TBN (Total Base Number) which they would not have been able to quantify without oil analysis. They can also get information on the decreases in additives or increases in contaminants which can allow them to identify or troubleshoot these issues in advance.
What Does This Report Mean?
While oil analysis can help our teams identify more information about the condition of the oil, we still need to ensure that they can read the oil analysis report and put measures in place to deal with the issues which may arise. In the example below, we will look through a typical diesel engine report as provided by ALS Tribology lab featured in STLE’s TLT magazine as shown in Figure 1.
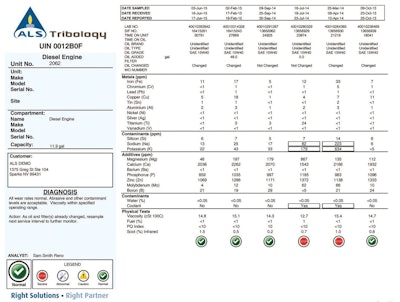 Figure 1. First page of Diesel Engine oil report adapted from Rensselar, 2016Rensselar, 2016
Most labs try to make it very easy for the report readers to assess the health of the oil, at a first glance. They usually implement a traffic light system where the status of the oil is highlighted. In this case, this oil has a normal rating indicating that the oil is still in good health and there isn’t anything to be concerned about yet as shown in Figure 2.
 Figure 2: Current condition of the oilRensselar, 2016
However, one of the main premises of oil analysis is the ability to spot trends over time and from this report, we can see that the oil may not have always been in a good condition as shown in figure 3. Each column represents an oil sample from a different date, so at a quick glance we can see that for two of the results, the oil was not in a good state whereas for the other results they remained in the normal region.
 Figure 3: Changing condition of the oilRensselar, 2016
One question that often gets asked is, “What is the normal region?”. Most oil analysis labs have collected data from OEMs which explicitly state the alarm limits for their pieces of equipment. As such, for each component, a lab should have matching data for alarm limits for the oil in that component. If none exists, then the lab may use a general industry guideline for these limits.
Therefore, if the actual value of the oil either exceeds or is below the limit, then this value will be flagged and the user notified. As seen in the report, there are basic sections into which these values are broken up, namely; metals, contaminants, additives and physical tests. Depending on the OEM, there will be different limits for these values.
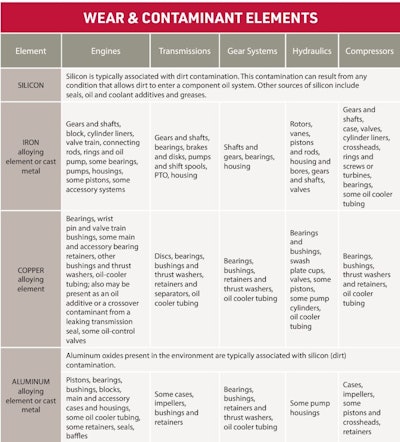
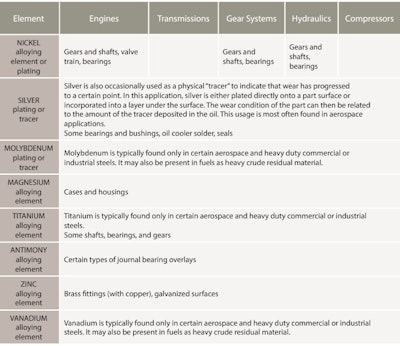
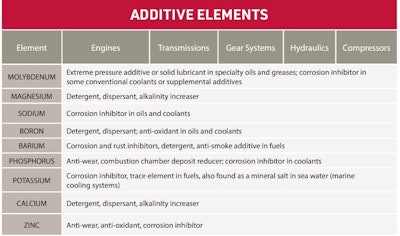
However, our teams need to be able to identify what the presence or absence of the elements mean for different components. CITATION Bur20 \l 1033 (Bureau Veritas, 2020) compiled a listing to help report readers understand this better as seen below.
|
| Figure 4. Identify what the presence or absence of the elements mean for different components (Bureau Veritas, 2020) |
Armed with this information, our teams can make more informed decisions. If they start seeing the quantity of Chromium increasing in their engines then this could be a sign of wear on the Liners and rings, shafts, valve train, bearings, shafts and gears, seals. Therefore, some investigations can begin on these components and possible wear can be addressed before the component gets damaged to the point that it can no longer function. Similarly, if they notice particular additives decrease over time such as zinc, then this could indicate that the antiwear additive is being depleted at a faster rate. These tables can guide report readers on what is actually occurring in their oils allowing them to properly plan for maintenance activities.
Implementing Oil Analysis for a Mixed Fleet
Now that we understand the value that oil analysis can bring, we need to be able to implement it, especially in mixed fleets. It is critical to clearly define the objectives of this program to ensure that we can monitor the value that oil analysis brings to our operations.
Ideally, the main objective of this program is to be able to monitor the health of the assets and prevent or reduce the possibility of a major failure or unplanned downtime. While it would be great to monitor the health of all the assets, this may not be entirely necessary.
Assets can be broken down into three main categories: critical, semi-critical and non-critical. The critical assets are the pieces of equipment which if they fail, can negatively impact the business. Semi-critical assets are those which if they fail, may have some impact on the business while non-critical assets are those whose failure do not impact on the business.
Depending on the nature of the business or the operations / projects which are ongoing at any point in time, your critical assets can switch in terms of priority to become semi-critical or a non-critical asset. For instance, if there was a job which required the use of a crane, then this would be our critical asset. However, if there was a job which did not require the use of a crane, then this asset becomes non-critical.
If we were dealing with the manufacturing industry where there are stationary pieces of equipment and a standard procedure, then the criticality of assets will not change as compared to a mixed fleet operation where contractors may have different jobs and require varying pieces of equipment.
Now that we’ve identified the critical assets / pieces of equipment, the sampling frequency must be determined. For critical assets, these may require some specialty tests as we want to ensure that we are alerted at the earliest possible time about an impending failure.
CITATION Bur20 \l 1033 (Bureau Veritas, 2020) provides some guidelines for oil sampling as per figure 4 below. However, the OEM guidelines should be adhered to once they exist. Even though the sampling intervals state 250 or 500 hours, these must be in accordance with the OEMs guidelines regarding maintenance as well.
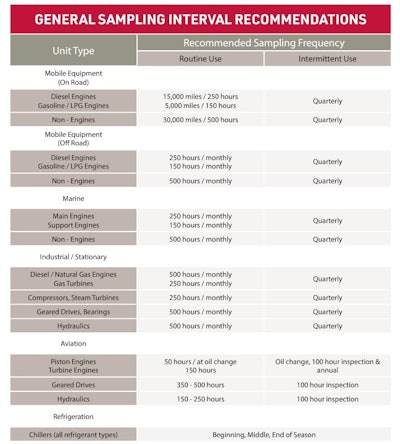 Figure 5. Guidelines for sampling as per Bureau Veritas, 2020Bureau Veritas, 2020
Typically, some OEMs may require an oil change at around 500 or 1000 hours (depending on the unit). If we only take the oil sample at the end of the life of the oil, then we are monitoring and trending how the oil ages at this point in time. However, if we’re trying to extend the oil drain interval of a component, then we would need to develop shorter intervals to monitor how the health of the oil is progressing and if it can indeed last for a longer time. If we’re attempting to extend the oil drain interval, then this should be done at increments of about a quarter of the usual interval.
Measuring the Success of an Oil Analysis Program
In a world where budgets rule the day and any additional program is shut down if merit cannot be found in it, being able to prove the success of your oil analysis program is critical. But how does one go about proving that the implementation of a program has stopped or reduced failures when there isn’t a big incident to compare it against? Simple, we start in the past to get to where we need to be in the future.
Documentation is always critical especially when we’re trying to build a case to implement some new measures. If previous failures have been documented, then the associated downtime and expenses such as additional labour, parts or expedited shipping and handling should also be taken account of. By detailing the costs associated with a failure or unplanned downtime from a lubrication issue, we can use this data to help determine the ROI of implementing the oil analysis program.
We need to then identify the times that the oil analysis program alerted the maintenance team about an upcoming issue or something that didn’t seem right which turned out to be a failing part or perhaps something that would cause some unplanned downtime. In these cases, we need to note what challenge we stopped or reduced the risk of occurring. By assigning a value to the failure that we prevented, we can then develop the ROI on the implementation of the oil analysis program.
Oil analysis can be a game changer for our maintenance teams in our fleets. It can help them to make more informed decisions allowing them to plan maintenance activities better and even reduce unwanted downtime. Oil analysis can be that hidden tool in our utility belt if we make use of it and implement it to help our fleets.
| References Bureau Veritas. (2020). The Basics of Oil Analysis Booklet. Retrieved from Bureau Veritas: https://oil-testing.com/wp-content/uploads/2020/08/Basics-of-Oil-Analysis-Booklet-2020V_compressed-1.pdf Rensselar, J. V. (2016, January). Unraveling the mystery of oil analysis flagging limits. STLE TLT magazine. |
