Highways are the arteries that keep the traveling public connected to vital resources, vacations and work related activities. These roadways have made expansion possible, connecting rural and urban communities as easy as hopping into your vehicle and within a few convenient turns, you will be on a highway and off to the destination of your choosing. Adequate and efficient transport system like highways, promotes economic development, benefits to industries, tourist destinations, emergency care and much more. However, when these throughways fail, detrimental issues arise.
The Reason Foundation’s Annual Highway Report measures the condition and cost-effectiveness of state-controlled highways in 13 categories, including urban and rural pavement condition, deficient bridges, traffic fatalities, spending per mile, and administrative costs per mile of highway maintained.
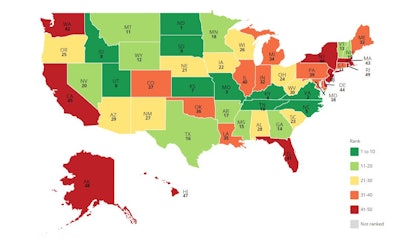
In the report, highway performance for state highways systems are based on 2019 and 2020 data, resulting in North Dakota, Virginia, Missouri, Kentucky and North Carolina to have the most cost-effective highway system. The study also found New Jersey, Rhode Island, Alaska, Hawaii and New York have the worst combination of highway performance and cost-effectiveness.
Nationally, the report shows America’s highway system improving in almost every category and more than half of the states (30 of 50) making progress. However, a 10-year average of overall performance data indicates that the nation’s highway system performance problems are largely concentrated in the bottom 10 states. And despite spending more and more money, most of these worst-performing states are finding it difficult to improve.
43% of the urban arterial primary mileage in poor condition is in just six states: California, Massachusetts, New York, New Jersey, Nebraska and Rhode Island. Approximately 25% of the rural Interstate mileage in poor condition is in just three states: Alaska, Colorado and Washington. And although a majority of states saw the percentage of structurally deficient bridges decline, five states report more than 15% of their bridges as structurally deficient: Rhode Island, West Virginia, Iowa, South Dakota and Pennsylvania.
Read More: I-40 Bridge Closure Puts the Cost of Doing Nothing to Repair Infrastructure on Display
For total spending on state-controlled highways, three states spent more than $250,000 per lane-mile: Massachusetts, New York and New Jersey. Inversely, five states—Missouri, South Carolina, West Virginia, North Dakota and South Dakota—spent less than $30,000 per mile of highway.
“States that spend a lot of money per mile need to ensure that their highway spending produces tangible results like smoother pavement, fewer deficient bridges, and less traffic congestion. The states with the best overall rankings typically have better-than-average highway system conditions, which are good for drivers, and combine that with relatively efficient spending in per-mile categories, which is good for taxpayers,” said Baruch Feigenbaum, lead author of the Annual Highway Report. “Numerous factors— budget priorities, maintenance philosophies, truck volumes, urbanization, system age, unit cost differences, terrain, climate, and more—are all impacting state highway conditions.”
Read Next: What Happens Now That the Infrastructure Bill is Signed Into Law?