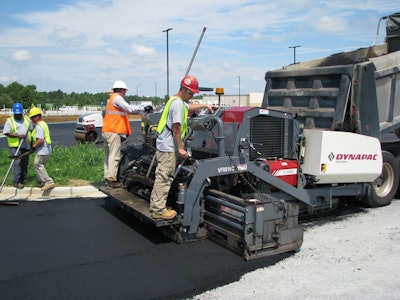
The 2021 Paving 75 contractors generated $681,489,281 in paving-only sales, which was slightly down from the $832 million in paving-only sales last year, and higher than the 2018 sales that equaled $493 million.
As noted in the Top Contractor overview, we believe sales numbers are slightly down, compared to last year, due to the economic uncertainty the coronavirus pandemic brought to our country. Customers might have been more conscientious of spending on big projects such as paving. However, the paving-only list still out paces, in terms of sales compared to the rest of the lists.
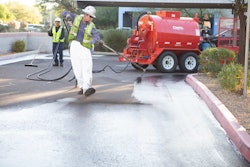
Paving-only sales continue to dwarf sales of other industry segment with pavement repair-only sales at $205 million ($217 million last year), followed by sealcoating-only sales at $108 million ($160 million last year) and striping-only sales coming in at $99 million ($204 million last year).
Total Sales for Paving 75
Total sales for all the work the 2021 Paving 75 contractors did was $1.336 billion. (Total sales last of the 2020 paving was $1.611, up from $1.046 billion generated from 2019 list.) When looking at the numbers side by side, it shows that the 2019 economy was strong (2020 Paving Top Contractor) and this years numbers are surprisingly higher than work generated in 2018.
This years paving-only sales represent 59% of total list sales - up from 51% in 2020's list. The remaining 41% of sales come from a broad mix of other pavement maintenance services:
- 65 companies perform sealcoating work
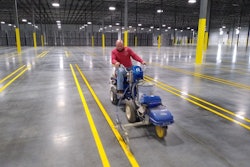
- 54 companies perform striping work
- 62 companies perform pavement repair work
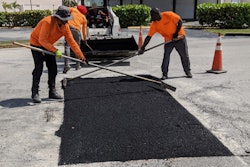
The paving list results certainly reinforce the diversity within the industry – in fact, only 3 of the 75 companies on the list performs only paving, though most of the companies on the list generate the major share of their work from paving.
Profit Margins
As the chart on this page shows, contractors profit margins within the 2021 Paving 75 continue to stay steady. The biggest fluctuation happens on the left side
- The percentage of Paving 75 contractors reporting margins greater than 15% remained steady at 40%, gaining 2% from last year
- Contractors reporting margins of 10-15% declined slightly to 26%
- That decline was picked up by contractors in the 5-10% range, which rose to 29% from 26% last year
- 1% of contractors reported margins in the 3-5% range, down from 6% last year
- 5% reported margins of less than 3% which is more than last year by 3%
For the most part, profit margins remained consistent across the board. For those who dropped, cost of material and paying for labor can be two contributing factors, especially during the turbulent year we had.
Types of Jobs the Paving 75 Completed
All 75 companies (97%) report sales from parking lots (two companies reporting less than 5%) making this the largest segment of type of work completed. Followed by streets and roads at 64% (48 companies reporting more than 5% of this type of work) and closely behind is driveway work at 48% (36 companies reported more than 5% of this type of work). 13% of companies reported highway work and only nine companies report any highway work at all.
The Paving 75s' Customers
- 75 contractors work for commercial/industrial customers
- 62 contractors work for multi-family residential customers
- 59 contractors work for municipal clients
- 40 contractors work for single-family homeowners
Despite the additional challenges 2020 brought to the industry, these figures remain consistent with past years results.
Replacing Equipment in the Paving 75s' Fleet
Not surprisingly, 44 of the Paving 47 companies reported it would cost more than $2 million to replace their equipment. Another 22 companies said it would cost between $1 and $2 million, while five companies reported it would cost between $500,000 and $1 million to replace their fleet. Only three companies reported in the $250,000-$500,000 range, while one company indicated they could replace their fleet for less than $250,000.