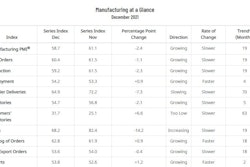
- New orders, production and employment growing
- Supplier deliveries slowing at a slower rate; backlog growing
- Manufacturing inventories growing; customers’ inventories too low
- Prices increasing; exports and imports growing
- Lack of raw materials hampers every sector
- Capital equipment lead times remain long
Economic activity in the manufacturing sector grew in November, with the overall economy achieving an 18th consecutive month of growth, say the nation’s supply executives in the latest Manufacturing ISM Report On Business.
The report was issued on Dec. 1 by Timothy R. Fiore, chair of the Institute for Supply Management (ISM) Manufacturing Business Survey Committee. The Manufacturing PMI, or the Purchasing Managers’ Index, is a set of economic indicators based off surveys of private-sector companies.
“The November Manufacturing PMI registered 61.1 %, an increase of 0.3 percentage point from the October reading of 60.8%. This figure indicates expansion in the overall economy for the 18th month in a row after a contraction in April 2020,” he says.
Several ongoing issues continue to impact manufacturing, Fiore says.
“The U.S. manufacturing sector remains in a demand-driven, supply chain-constrained environment, with some indications of slight labor and supplier delivery improvement,” he says. “All segments of the manufacturing economy are impacted by record-long raw materials and capital equipment lead times, continued shortages of critical lowest-tier materials, high commodity prices and difficulties in transporting products. Coronavirus pandemic-related global issues — worker absenteeism, short-term shutdowns due to parts shortages, difficulties in filling open positions and overseas supply chain problems — continue to limit manufacturing growth potential.”
Aluminum, copper, corrugate and packaging materials; electrical and electronic components; energy; some plastics and plastic products; freight; and steels continue to remain at elevated prices due to product scarcity, he says.
Manufacturing executives remain optimistic about the economy, however.
“Panel sentiment remains strongly optimistic, with 10 positive growth comments for every cautious comment,” he says. “Panelists remain focused on the importance of improving supply chain issues to respond to ongoing high levels of demand. Demand expanded, with the new orders index growing, supported by continued expansion of the new export orders index, customers’ inventories index remaining at a very low level and backlog of orders index staying at a very high level.”
Consumption, measured by the production and employment indexes, grew during the period, with a combined 3.5-percentage point increase to the Manufacturing PMI calculation.
“We are experiencing significant supply chain disruptions, which are resulting in historically long lead times to get product to our customers. Commodity-based inflationary pressures are widespread, and traditional means of addressing these pressures are not effective due to unprecedented demand,” a survey respondent in the miscellaneous manufacturing sector reports.
The Employment Index expanded for a third month, with some indications that the ability to hire is improving, partially offset by the challenges of turnover and backfilling, Fiore says. Inputs — expressed as supplier deliveries, inventories, and imports — continued to constrain production expansion, but there are early signs of supplier performance improving. The Supplier Deliveries Index slowed again but at a slower rate, while the Inventories Index expanded more slowly. In November, the prices index expanded for the 18th consecutive month, at a slower rate, indicating continued supplier pricing power and scarcity of supply chain goods.
“All of the six biggest manufacturing industries — computer and electronic products; food, beverage and tobacco products; chemical products; petroleum and coal products; fabricated metal products; and transportation equipment, in that order — registered moderate to strong growth in November,” Fiore says. “Manufacturing performed well for the 18th straight month, with demand and consumption registering month-over-month growth, in spite of continuing obstacles. Meeting demand remains a challenge, due to hiring difficulties and a clear cycle of labor turnover at all tiers.”
Panelists’ comments suggest month-over-month improvement on hiring, offset by backfilling required to address employee turnover. Indications that supplier delivery rates are improving were supported by the supplier deliveries index softening, Fiore says.
“Transportation networks, a harbinger of future supplier delivery performance, are still performing erratically,” he says.
The 13 manufacturing industries reporting growth in November, in the following order, are: apparel, leather and allied products; furniture and related products; electrical equipment, appliances and components; computer and electronic products; machinery; plastics and rubber products; paper products; food, beverage and tobacco products; miscellaneous manufacturing; chemical products; petroleum and coal products; fabricated metal products; and transportation equipment. The two industries reporting a decrease in November compared to October are: printing and related support activities; and primary metals.
“International component shortages continue to cause delays in completing customer orders. Backlog continues to increase,” a respondent in the computer and electronic products sector reports.
Commodities
The following commodities increased in price (in parentheses is the number of months prices have been increasing): adhesives (5); aluminum* (18); aluminum products (8); caustic soda (6); copper (3); corrugate (14); corrugated packaging (13); crude oil (2); diesel fuel (11); electrical components (12); electronic components (12); freight (13); gasoline; hydraulic components; labor — temporary (7); magnesium; motors (2); natural gas (5); nylon (2); ocean freight (12); packaging supplies (12); paper (3); plastic containers (3); plastic resins* (15); resin-based products (10); rubber-based products (4); semiconductors (10); silicon; silicone; soy products; steel* (16); steel — cold rolled (4); steel — hot rolled* (15); steel — stainless (13); steel products (15); surfactants; and zinc. Commodities down in price include: aluminum*; plastic resins*; polypropylene; steel*; and steel — hot rolled*. Commodities in short supply include: aluminum; aluminum products; corrugated packaging (5); electrical components (14); electronic components (12); fasteners; freight (3); glass bottles; hydraulic components; labor — temporary (7); magnesium; ocean freight (8); ocean freight containers (2); paper; plastic containers (3); plastic products (10); plastic resins — other (9); printed circuit board assemblies (pcbas) (4); semiconductors (12); silicone; steel (12); and steel products (10).
*Indicates those commodities reported both up and down in price.
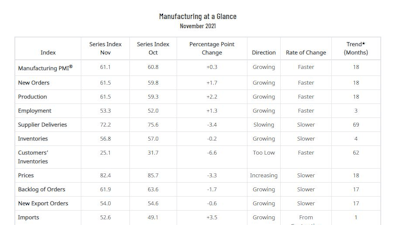
 Manufacturing At a Glance chart.ISM
Manufacturing Summary
Manufacturing grew in November, as the Manufacturing PMI registered 61.1%, 0.3 percentage point higher than the October reading of 60.8%.
“The Manufacturing PMI continued to indicate strong sector expansion and U.S. economic growth in November,” Fiore says. “All five subindexes that directly factor into the Manufacturing PMI were in growth territory. All of the six biggest manufacturing industries expanded, in the following order: computer and electronic products; food, beverage and tobacco products; chemical products; petroleum and coal products; fabricated metal products; and transportation equipment. The new orders and production indexes remained at strong levels. The supplier deliveries index continued to reflect suppliers’ difficulties in maintaining delivery rates, but at slightly softening levels.”
All 10 of the subindexes were positive for the period; a reading of ‘too low’ for the customers’ inventories index is considered a positive for future production. A reading above 50% indicates that the manufacturing economy is generally expanding; below 50% indicates that it is generally contracting.
A Manufacturing PMI above 43.1%, over a period of time, generally indicates an expansion of the overall economy. Therefore, the November Manufacturing PMI indicates the overall economy grew in November for the 18th consecutive month following contraction in April 2020. “The past relationship between the Manufacturing PMI and the overall economy indicates that the Manufacturing PMI for November (61.1%) corresponds to a 5.1-percent increase in real gross domestic product (GDP) on an annualized basis,” he says.
New Orders
ISM’s New Orders Index registered 61.5% in November, an increase of 1.7 percentage points compared to the 59.8% reported in October. This indicates that new orders grew for the 18th consecutive month.
“Three of the six largest manufacturing sectors — computer and electronic products; food, beverage and tobacco products; and chemical products — expanded at moderate-to-strong levels, down from all six the previous month,” says Fiore.
A New Orders Index above 52.8%, over time, is generally consistent with an increase in the Census Bureau’s series on manufacturing orders (in constant 2000 dollars).
Ten of 18 manufacturing industries reported growth in new orders in November, in the following order: apparel, leather and allied products; plastics and rubber products; furniture and related products; machinery; computer and electronic products; miscellaneous manufacturing; electrical equipment, appliances and components; food, beverage and tobacco products; paper products; and chemical products. The five industries reporting a decline in new orders in November are: printing and related support activities; primary metals; nonmetallic mineral products; transportation equipment; and fabricated metal products.
 ISM
ISM
Production
The Production Index registered 61.5% in November, 2.2 percentage points higher than the October reading of 59.3%, indicating growth for the 18th consecutive month.
“Four of the top six industries — petroleum and coal products; computer and electronic products; chemical products; and food, beverage and tobacco products — expanded at moderate-to-strong levels,” Fiore says. “Raw material shortages remain a constraint to production growth, as suppliers continue to struggle. Factory floor staffing remains an obstacle, with direct-labor turnover continuing a negative trend.”
An index above 52.1%, over time, is generally consistent with an increase in the Federal Reserve Board’s Industrial Production figures.
The 11 industries reporting growth in production during the month of November — listed in order — are: petroleum and coal products; textile mills; furniture and related products; paper products; electrical equipment, appliances and components; computer and electronic products; machinery; chemical products; miscellaneous manufacturing; food, beverage and tobacco products; and plastics and rubber products. The four industries reporting a decrease in November are: printing and related support activities; nonmetallic mineral products; primary metals; and fabricated metal products.
 ISM
ISM
Employment
ISM’s Employment Index registered 53.3% in November, 1.3 percentage points above the October reading of 52%.
“The Employment Index reported a third month of expansion,” Fiore says. “Of the six big manufacturing sectors, three (computer and electronic products; chemical products; and fabricated metal products) expanded. Survey panelists’ companies are still struggling to meet labor-management plans, but for a third month, there were modest signs of progress: An increasing share of comments (7%, compared to 5% in October) noted improvements regarding employment. An overwhelming majority of panelists indicate their companies are hiring or attempting to hire — 86% of employment index comments were hiring focused. Fifty-one% of those respondents expressed difficulty in filling positions, an increase from October. The increasing frequency of comments on turnover rates (backfills and retirements) in November continued a trend that began in August.”
An Employment Index above 50.6%, over time, is generally consistent with an increase in the Bureau of Labor Statistics (BLS) data on manufacturing employment.
Of 18 manufacturing industries, the 10 industries reporting employment growth in November, in the following order, are: apparel, leather and allied products; paper products; electrical equipment, appliances and components; furniture and related products; machinery; plastics and rubber products; computer and electronic products; chemical products; fabricated metal products; and miscellaneous manufacturing. The five industries reporting a decrease in employment in November are: textile mills; printing and related support activities; nonmetallic mineral products; transportation equipment; and food, beverage and tobacco products.
“While steel plate and hot-rolled coil pricing seems to be approaching a plateau, the biggest challenge we have at the moment is finding qualified workers,” a respondent in the fabricated metal products sector reports.
 ISM
ISM
Supplier Deliveries
The delivery performance of suppliers to manufacturing organizations was slower in November, as the Supplier Deliveries Index registered 72.2%, 3.4 percentage points lower than the 75.6% reported in October.
All six top manufacturing industries — food, beverage and tobacco products; fabricated metal products; computer and electronic products; chemical products; transportation equipment; and petroleum and coal products, in that order — reported slowing deliveries.
“Deliveries slowed at a slower rate compared to the previous month,” Fiore says. “The index continues to reflect suppliers’ difficulties in meeting panelist companies’ demand, including ongoing supplier hiring and turnover challenges, extended raw materials lead times for all tiers, high levels of input material shortages, elevated prices and inconsistent transportation availability. Capital expenditures and production materials lead times are at or near their highest recorded levels. We may now be at peak; if so, the December data will confirm.”
A reading below 50% indicates faster deliveries, while a reading above 50% indicates slower deliveries.
Sixteen of 18 industries reported slower supplier deliveries in November, in the following order: apparel, leather and allied products; nonmetallic mineral products; food, beverage and tobacco products; miscellaneous manufacturing; furniture and related products; fabricated metal products; computer and electronic products; printing and related support activities; machinery; electrical equipment, appliances and components; paper products; chemical products; transportation equipment; petroleum and coal products; textile mills; and plastics and rubber products. No industries reported faster supplier deliveries in November.
 ISM
ISM
Inventories
The Inventories Index registered 56.8% in November, 0.2 percentage point lower than the 57% reported for October.
“Manufacturing inventories continued to expand due to panelists’ companies continuing to stock more raw materials to help avoid production shortages, as well as growth in work-in-process and finished-goods inventories due to specific part shortages and holdbacks from some customers in several industries,” Fiore says.
An Inventories Index greater than 44.5%, over time, is generally consistent with expansion in the Bureau of Economic Analysis (BEA) figures on overall manufacturing inventories (in chained 2000 dollars).
The 10 industries reporting higher inventories in November, in the following order, are: apparel, leather and allied products; electrical equipment, appliances and components; furniture and related products; plastics and rubber products; food, beverage and tobacco products; computer and electronic products; machinery; transportation equipment; chemical products; and fabricated metal products. The three industries reporting a decrease in inventories in November are: printing and related support activities; paper products; and primary metals.
 ISM
ISM
Customers’ Inventories
ISM’s Customers’ Inventories Index registered 25.1% in November, 6.6 percentage points less than the 31.7% reported for October, indicating that customers’ inventory levels were considered too low.
“Customers’ inventories are too low for the 62nd consecutive month, a positive for future production growth,” Fiore says. “For 16 straight months, the customers’ inventories index has been at historically low levels, and November’s reading of 25.1% is the second-lowest ever (above only July’s figure of 25.0%) for this index.”
No industries reported higher customers’ inventories in November. The 15 industries reporting customers’ inventories as too low during November, listed in order, are: wood products; petroleum and coal products; nonmetallic mineral products; machinery; miscellaneous manufacturing; primary metals; paper products; furniture and related products; fabricated metal products; electrical equipment, appliances and components; computer and electronic products; food, beverage and tobacco products; plastics and rubber products; chemical products; and transportation equipment.
 ISM
ISM
Prices
The ISM Prices Index registered 82.4%, a decrease of 3.3 percentage points compared to the October reading of 85.7%, indicating raw materials prices increased for the 18th consecutive month, at a slower rate in November.
This is the 15th month in a row that the index has been above 60% and the 12th consecutive month it has exceeded 70%.
“Aluminum, copper, corrugate and packaging materials; electrical and electronic components; energy; some plastics and plastic products; freight; and steels continue to remain at elevated prices due to product scarcity,” says Fiore.
A Prices Index above 52.7%, over time, is generally consistent with an increase in the Bureau of Labor Statistics (BLS) Producer Price Index for Intermediate Materials.
In November, all 18 industries reported paying increased prices for raw materials, in the following order: apparel, leather and allied products; nonmetallic mineral products; textile mills; wood products; furniture and related products; paper products; miscellaneous manufacturing; transportation equipment; primary metals; computer and electronic products; petroleum and coal products; food, beverage and tobacco products; electrical equipment, appliances and components; chemical products; machinery; fabricated metal products; printing and related support activities; and plastics and rubber products.
 ISM
ISM
Backlog of Orders
ISM ’s Backlog of Orders Index registered 61.9% in November, a 1.7-percentage point decrease compared to the 63.6% reported in October, indicating order backlogs expanded for the 17th straight month.
This is the 10th consecutive month with a reading above 60%.
“Backlogs expanded at a slower rate in November, indicating production was able to keep up with continuing strong new order levels,” Fiore says. “Of the six big industry sectors, five (food, beverage and tobacco products; computer and electronic products; fabricated metal products; chemical products; and transportation equipment) reported that backlogs expanded strongly.”
The 13 industries reporting growth in order backlogs in November, in the following order, are: apparel, leather and allied products; wood products; machinery; paper products; food, beverage and tobacco products; computer and electronic products; primary metals; fabricated metal products; chemical products; electrical equipment, appliances and components; miscellaneous manufacturing; transportation equipment; and plastics and rubber products.
“In the first nine months of the year, business conditions were off the charts, and sales by far outpaced capacity. This has put backlog at record levels and, surprisingly, customers have been willing to wait, albeit reluctantly. However, there seems to be a flattening: Sales remain strong but are not growing at the same month-over-month pace from the previous six to nine months,” a survey respondent in the machinery sector reports.
The only industry reporting lower backlogs in November is textile mills.
“We are still seeing shortages with various metals. Plastic resins seem to be slowly improving. Electronic component lead times are still moving out,” says a survey respondent in the electrical equipment, appliances and components sector.
 ISM
ISM
New Export Orders
ISM’s New Export Orders Index registered 54% in November, down 0.6 percentage point compared to the October reading of 54.6%.
“The New Export Orders Index grew for the 17th consecutive month, at a slightly slower rate,” Fiore says. “Of the six big industry sectors, four (food, beverage and tobacco products; chemical products; transportation equipment; and computer and electronic products) expanded. New export orders were a contributor to the new orders index continuing in strong expansion territory.”
The nine industries reporting growth in new export orders in November, in the following order, are: plastics and rubber products; primary metals; miscellaneous manufacturing; machinery; food, beverage and tobacco products; electrical equipment, appliances and components; chemical products; transportation equipment; and computer and electronic products. The only industry reporting a decrease in new export orders in November is paper products. Six industries reported no change in exports in November as compared to October.
 ISM
ISM
Imports
ISM ’s Imports Index registered 52.6% in November, an increase of 3.5 percentage points compared to October’s figure of 49.1%.
“Imports expanded in November after one month of contraction, in spite of continuing challenges with throughput at U.S. ports of entry,” Fiore says. “Overland transport challenges and container shortages continue to persist across the global supply chain, causing instability with import level projections. Imports will continue to be challenged through the end of 2021 and likely through the first half of 2022.”
The seven industries reporting growth in imports in November, in the following order, are: textile mills; computer and electronic products; miscellaneous manufacturing; food, beverage and tobacco products; machinery; fabricated metal products; and chemical products. The four industries reporting a decrease in imports in November are: nonmetallic mineral products; primary metals; plastics and rubber products; and electrical equipment, appliances and components. Seven industries reported no change in imports in November as compared to October.
 ISM
ISM
Buying Policy
Average commitment lead time for capital expenditures in November was 160 days, an increase of four days compared to October. Capital expenditures lead times have increased in nine of the last 12 months for a net increase of 28 days since December 2020 (132 days). Average lead time in November for production materials was unchanged at 96 days; this figure is the highest since ISM began reporting this data in 1987, tying the record set in October. Average lead time for Maintenance, Repair and Operating (MRO) supplies was 44 days, down five days compared to October.