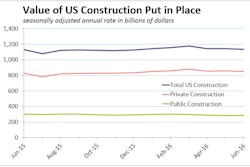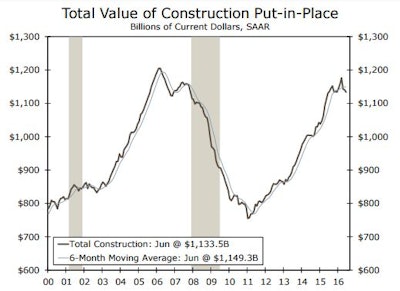
The consensus forecast of the total nominal value of construction spending put in place in June expected an increase of 0.5%, but missed big again, when the U.S. Commerce Department’s estimate showed the number slipping 0.6% to a seasonally adjusted annual rate of $1,133.5 billion. The value of total construction put in place is known for its wild monthly swings and stark revisions, but the consensus of economists watching the industry has missed the direction of the spending change for three straight months.
In April, construction outlays were expected to increase 0.6%, and outlays actually fell 2.9%. For May, construction forecasters were looking for expenditures to grow 0.6%, but expenditures in fell 0.1%. And in keeping with the second quarter trend, June also surprised to the downside.
This divergence begs the question: “Are we seeing weakness due to volatility, or are we are at a turning point and forecasters are missing the signal?”
Looking at the construction data by sector, we find private construction fell 0.6%, and public spending also slipped 0.6%.
With the exception of private residential, which came in flat due to increase in home improvement, the overall report was pretty disappointing. For private nonresidential, the three-month annualized rate is down and suggests we are seeing a downshift. The trend in private single-family is also weak.
Private nonresidential construction spending fell 1.3% in June with manufacturing shaving 0.8 percentag points from the headline.
Transportation equipment fell 10.9% during the month and is down 5.9% relative to a year earlier. Although the U.S. Census Bureau does not break out the components of transportation equipment, we can glean the underlying drivers from the monthly industrial production report. Industrial production shows transportation equipment output trekking higher in June, but heavy duty truck output has fallen in each of the last three months. It is down 10.1% year over year. Weakness in heavy duty truck output is often seen as a harbinger for a turn in the construction cycle.
According to the U.S. Bureau of Economic Analysis (BEA), structure investment slipped at a 7.9% annualized pace in the second quarter. Based on the BEA’s conservative assumption on structure and residential construction spending for June, we do not expect any revisions to second quarter real GDP growth, all else equal.
One interesting point to make is that the American Institute of Architects' Architecture Billings Index (a measure of planning for commercial construction) is at odds with the recent trend in construction outlays, while starts continue to point to a weak trend.