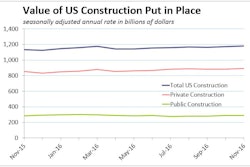
At a seasonally adjusted annual rate of $638.3 billion, new construction starts in November retreated 6% from October, according to Dodge Data & Analytics. Each of the three major construction sectors experienced reduced activity in November.
Nonresidential building continued to recede from its elevated September pace, even with the November start of several large projects, most notably the $3.0 billion new football stadium for the Los Angeles Rams in Inglewood CA. Residential building in November settled back after strengthening in October, maintaining the up-and-down pattern that’s been present since August. Nonbuilding construction in November declined after its public works segment had been lifted in October by the start of several large projects, including the $1.7 billion Mid-Coast Corridor Transit Project in San Diego CA and the $850 million State Highway 288 Tollway project in the Houston TX area.
For the first 11 months of 2016, total construction starts on an unadjusted basis were $627.2 billion, essentially matching the amount reported for the same period a year ago. During the second half of 2016, the year-to-date performance for total construction starts has shown consistent improvement, even with the recent deceleration, given the comparison to the weaker activity reported during last year’s second half. Excluding the volatile manufacturing plant and electric utility/gas plant categories, total construction starts during this year’s January-November period would be up 4%.
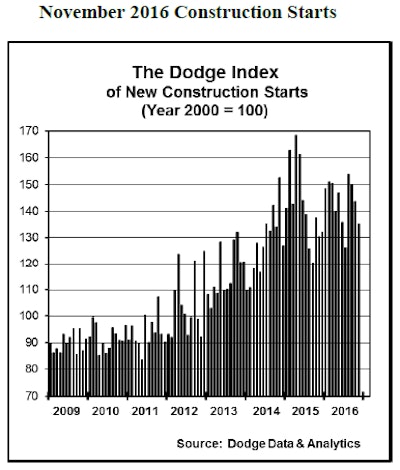
The November statistics lowered the Dodge Index to 135 (2000=100), down from a revised 143 for October. While the Dodge Index has retreated from its most recent high of 154 in August, the November reading was still 7% above this year’s low of 126 in July.
“The path of expansion for construction activity has been hesitant in recent years, with gains followed by setbacks, and this has certainly been true during 2016,” stated Robert A. Murray, chief economist for Dodge Data & Analytics. “After a lackluster second quarter, total construction starts showed improvement during the third quarter, and have receded so far during the fourth quarter. On the plus side, the year-to-date amount for nonresidential building in dollar terms is now showing growth, joining the gains that have been reported for residential building over the course of 2016. The public works sector remains slightly lower than a year ago, although the extent of its shortfall has become smaller.
“Going forward, the construction industry should still benefit from several positive factors,” Murray continued. “For commercial building, vacancy rates have yet to show much in the way of upward movement. For institutional building, funding support for school construction is coming from the passage of such recent state bond measures as the $9 billion Proposition 51 in California. For residential building, while mortgage rates have risen they remain at historically low levels for the present, and demand for housing from millennials seems to be picking up. For public works, support is coming from recent bond measures passed at the state level, although the continuing resolution just passed by Congress for fiscal 2017 federal appropriations did not provide an increase for highway funding. What remains to be seen is the extent to which Congress will respond to the proposals by the incoming Trump Administration for greater infrastructure spending and less regulation of the banking sector.”
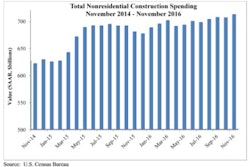
Nonresidential building in November dropped 5% to $224.6 billion (annual rate). The commercial building categories as a group fell 20%, with declines reported for four of the five project types – stores and shopping centers, down 10%; commercial garages, down 16%; office buildings, down 33%; and hotels, down 46%.
Despite the decline, the office category did include several major projects as November starts – the $264 million office portion of the $280 million mixed-use Tower Three of the Amazon Block 20 development in Seattle WA, the $250 million McDonald’s headquarters in Chicago IL, and the $139 million office portion of the $200 million Citizens Financial corporate campus in Johnston RI. Warehouse construction was the one commercial project type that was able to report a November gain, rising 37%, led by groundbreaking for three large warehouse projects located in Staten Island NY ($304 million), Cranbury NJ ($200 million), and Olathe KS ($100 million). The manufacturing plant category in November plunged 54% after being lifted in October by the start of a $1.4 billion ethylene plant in Louisiana. Still, there were several large manufacturing plant projects that reached groundbreaking in November, including a $450 million expansion to an ExxonMobil refinery in Beaumont TX.
The institutional side of the nonresidential building market advanced 22% in November. Leading the way was a 206% jump for the amusement-related category, which featured the start of the $3.0 billion football stadium for the Los Angeles Rams in Inglewood CA. Also strengthening in November was the public buildings category, which climbed 29% with the boost coming from the $267 million city hall portion of the $513 million New Long Beach Civic Center in Long Beach CA. The other institutional categories lost momentum in November. Healthcare facilities receded 2%, although November did include the start of five hospital projects valued each at $100 million or more, including a $300 million hospital in Silver Spring MD. The educational facilities category was down 6%, with the largest November project being a $107 million cyber security studies building at the U.S. Naval Academy in Annapolis MD. November declines were also registered by transportation terminals, down 34%, and religious buildings, down 45%.
Through the first 11 months of 2016, nonresidential building was up 2% compared to the same period a year ago. The commercial building group climbed 10% year-to-date, reflecting increases for office buildings, up 18%; hotels, up 16%; and warehouses and commercial garages, each up 11%. Store construction was the one commercial project type that registered a year-to-date decline, sliding 8%. The institutional building group in the first 11 months of 2016 increased 4% from a year ago, with healthcare and educational facilities (the two largest institutional project types), up 8% and 1% respectively. The smaller institutional categories were mixed, with gains for amusement-related work, up 32%; and transportation terminals, up 17%; while declines were reported for public buildings, down 5%; and religious buildings, down 29%.
Residential building, at $275.4 billion (annual rate), fell 5% in November. Multifamily housing pulled back 12% from its improved October level, continuing the fluctuating pattern of recent months. There were 10 multifamily projects valued at $100 million or more that reached groundbreaking in November, down slightly from the 11 such projects reported in October.
The largest multifamily projects that reached groundbreaking in November included three located in Boston MA – the $625 million Seaport Square residential towers, the $209 million Bulfinch Crossing residential tower, and the $198 million multifamily portion of the $225 million Clippership Wharf mixed-use project. Other large multifamily projects reported as November starts were a $228 million apartment building in Alexandria VA and the $169 million multifamily portion of a $200 million mixed-use building in Denver CO.
Single-family housing in November slipped 2% from its heightened October amount, although November was still generally healthy by recent standards, coming in 2% above the average for the previous ten months. During the January-November period of 2016, residential building was up 6% compared to last year. The gain was due primarily to a 7% increase for single-family housing, reflecting this year-to-date pattern by major region – the Midwest, up 10%; the South Atlantic, up 9%; the West, up 7%; the Northeast, up 5%; and the South Central, up 3%.
Multifamily housing registered a smaller year-to-date increase, edging up just 2%. The nation’s leading multifamily market by dollar volume, New York NY, dropped 26% year-to-date from its robust amount in 2015. If the New York NY metropolitan area is excluded, multifamily housing for the nation would be up 11% during this year’s first eleven months. Rounding out the top five multifamily markets in the January-November period, with their percent change from a year ago, were the following – Los Angeles CA, up 40%; Miami FL, up 17%; Chicago IL, up 82%; and Washington DC, up 22%. Metropolitan areas ranked 6 through 10 were the following – Boston MA, up 37%; Dallas-Ft. Worth TX, up 30%; San Francisco CA, up 60%; Atlanta GA, up 42%; and Denver CO, up 30%.
Nonbuilding construction descended 9% in November to $138.3 billion (annual rate), due to a 21% decline for the public works categories as a group after a 21% hike in October.
The miscellaneous public works category, which includes mass transit projects and site work, fell 57% after being lifted in October by the start of the $1.7 billion Mid-Coast Corridor Transit Project in San Diego CA. By contrast, the largest miscellaneous public works project entered as a November start was the $155 million Yerba Buena Island Redevelopment site work in San Francisco CA. Highway and bridge construction in November fell 16% after a strong October which included the $850 million State Highway 288 Tollway project in the Houston TX area. November’s highway and bridge construction, although weaker than October, did include the start of the $803 million U.S. 181 Harbor Bridge Replacement Project in Corpus Christi TX.
The environmental public works categories in November were mixed, with water supply systems down 6%; sewer systems up 19%, and river/harbor development up 88% with the help of $747 million of site work for a marine container terminal in North Charleston SC.
Running counter to the overall decline for public works construction in November was a 58% increase for the electric utility and gas plant category, boosted by the start of the $2.1 billion Elba Island Liquefaction Project in Savannah GA, which will enhance natural gas liquefaction and exporting capabilities at that location.
During the first 11 months of 2016, nonbuilding construction was down 9% from the same period a year ago. The public works categories as a group retreated 3%, due primarily to a 13% drop for highway and bridge construction from the elevated amount reported in 2015. The other public works categories showed a varied year-to-date pattern – sewer systems, down 14%; river/harbor development, down 3%; water supply systems, up 1%; and miscellaneous public works, up 28% as the result of a greater dollar amount for pipeline and mass transit projects. The electric utility and gas plant category year-to-date dropped 23%, reflecting a sharp 67% decrease in the dollar amount of gas plant projects while the power-related portion of the category grew 17%.
The “no change” for total construction starts at the national level during the first 11 months of 2016 was the result of a mixed performance for total construction starts at the five-region level. Year-to-date total construction gains were reported in the West, up 10%; the South Atlantic, up 9%; and the Midwest, up 6%. Year-to-date total construction declines were reported in the Northeast, down 1%; and the South Central, down 17% which reflected that region’s comparison to last year which included the start of several massive liquefied natural gas export terminals.


![[VIDEO] Construction Groups Urge Trump to Buck Republicans on Road Spending](https://img.forconstructionpros.com/files/base/acbm/fcp/image/2017/01/default.586c055d75516.png?auto=format%2Ccompress&fit=crop&h=167&q=70&w=250)