New construction starts in March increased 5% to a seasonally adjusted annual rate of $743.7 billion, marking the third straight monthly gain, according to data collected by Dodge Data & Analytics. Total construction growth in March was led by the nonbuilding sector, and particularly by public works which featured the start of two large pipeline projects – the $4.2 billion Rover natural gas pipeline in Ohio and Michigan, and the $2.5 billion Mariner East 2 propane and natural gas liquids pipeline in Pennsylvania.
 New construction starts in March increased 5% to a seasonally adjusted annual rate of $743.7 billion, led by nonbuilding-sector growth. It marked the third straight monthly gain.Dodge Data & Analytics
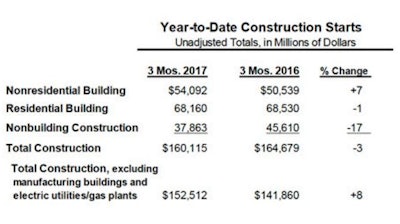
Through the first three months of 2017, total construction starts on an unadjusted basis were $160.1 billion, down 3% from the same period a year ago (which included heightened activity for manufacturing plants and electric utilities/gas plants). If the often-volatile manufacturing plant and electric utility/gas plant categories are excluded, total construction starts during the first three months of 2017 would be up 8% relative to last year.
March data a reading of 157 for the Dodge Index (where conditions in 2000 set the benchmark at 100), compared to 149 in February and 147 in January. After sliding to a weak 129 in December, the Dodge Index over the next three months bounced back 22%. On a quarterly basis, the Dodge Index averaged 151 during this year’s January-March period, up 9% compared to the 139 average for the fourth quarter of 2016. “The pattern for construction starts in early 2017, with three straight monthly gains, is the reverse of the three straight monthly declines that closed out 2016,” noted Robert A. Murray, chief economist for Dodge Data & Analytics.
“While the construction-start statistics will frequently show an up-and-down pattern, whether month-to-month or quarter-to-quarter, the improved activity in this year’s first quarter provides evidence that the construction expansion is still proceeding,” Murray continued. “This year’s first quarter has seen nonresidential building and public works rebound from the loss of momentum each experienced towards the end of 2016, helped respectively by the strong activity so far in 2017 for new airport terminal projects and new pipeline projects.
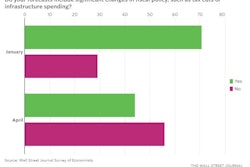
“Nonresidential building in 2017 should be able to stay on its upward track, supported by further growth for such institutional project types as school construction,” Murray added. “As for public works, it’s also expected to show improvement over the course of 2017, although its prospects are less certain given its connection to legislative developments at the federal level. This includes how Congress will deal with the continuing resolution for fiscal 2017 appropriations scheduled to expire at the end of April, and whether a new federal infrastructure program will get passed this year.”
Nonbuilding construction in March jumped 16% to $195.7 billion (annual rate), following its 35% hike in February. The public works sector surged 33%, reflecting an 82% increase in March for the miscellaneous public works category that includes such diverse project types as site work, pipelines, mass transit, and outdoor sports stadiums.
The $4.2 billion Rover natural gas pipeline was included as a construction start in March, and is located mostly in Ohio and Michigan with smaller portions in West Virginia and Pennsylvania. Also reported as a March start was the $2.5 billion Mariner East 2 Pipeline, located mostly in Pennsylvania with smaller portions in West Virginia and Ohio, which will transport propane and other natural gas liquids from the Marcellus Shale natural gas fields in southwestern Pennsylvania to a processing and distribution facility near Philadelphia.
The start of a $300 million stadium in Washington DC for the DC United soccer team also contributed to the substantial March increase for miscellaneous public works.
The commercial side of the nonresidential building market increased 7% in March, showing improvement after a 10% drop in February. Office construction climbed 41%,Highway and bridge construction in March edged up 1%, essentially holding at the improved volume achieved with its 38% jump in February. Large highway and bridge projects entered as March construction starts were a $399 million bridge replacement in the Pensacola, Fla., area, the $266 million Sixth Street Viaduct replacement in Los Angeles, Ca., and a $192 million highway expansion project in San Antonio, Texas.
River/harbor development in March advanced 32% from its lackluster February amount, while sewer construction was unchanged and water supply construction slipped 2%. The electric utility/gas plant category in March retreated 54%, although it did include as construction starts a $300 million wind farm in Ohio and a $175 million solar farm in Virginia.
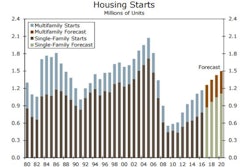
Residential building, at $310.8 billion (annual rate), grew 4% in March. Multifamily housing provided the upward push, rebounding 26% after a 23% setback in February. There were six multifamily projects valued at $100 million or more that reached groundbreaking in March, led by a $200 million apartment building in Washington, D.C., and a $150 million apartment building in New York, N.Y.
Through the first three months of 2017, the top five metropolitan areas in terms of the dollar amount of multifamily starts were the following – New York, N.Y., Los Angeles, Calif., Washington, D.C., Chicago, Ill., and Atlanta Ga.. During this period, the New York metropolitan area accounted for 18% of the national multifamily total, up slightly from the 17% share for full year 2016 but down from the 25% share for full year 2015.
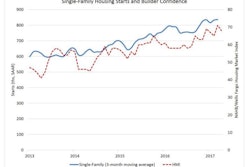
Single-family housing in March receded 3%, which followed modest improvement reported during the previous five months. By region, single family housing in March showed this pattern:
- Midwest: down 9%
- West: down 3%
- South Central: down 3%
- South Atlantic: down 2%
- Northeast: up 3%
Nonresidential building in March, at $237.2 billion (annual rate), was essentially unchanged from its February pace. The institutional side of the nonresidential building market grew 3% in March, with much of the support coming from an 83% surge for the transportation terminal category.
Large airport terminals that were reported as March starts included two at Los Angeles International Airport – the $1.9 billion Delta relocation to Terminals 2 and 3 and the $961 million Midfield Satellite Concourse North (phase 1). Also entered as a March start was the $110 million Terminal 2 modernization at Fort Lauderdale-Hollywood International Airport. Through the first three months of 2017, the dollar amount of new airport terminal projects was $9.0 billion (including the $3.4 billion Central Terminal Building at New York’s LaGuardia Airport), easily topping the $3.7 billion in new airport terminal starts for full year 2016.
Healthcare facilities in March increased 13%, aided by the start of these large projects – the $265 million Methodist University Hospital in Memphis, Tenn., and the $230 million North Alabama Medical Center in Florence, Ala.
Also strengthening in March were religious buildings, up 9%; and public buildings (courthouses and detention centers), up 4%.
On the negative side, educational facilities in March dropped 14% after February’s 11% gain, although March did include these noteworthy projects as construction starts – a $289 million research institute building in Seattle, Wa., a $170 million library and classroom facility at Temple University in Philadelphia, Penn., and a $138 million science building renovation at the University of Virginia in Charlottesville, Va.
Also retreating in March was the amusement and recreational category, which fell 29%.
The commercial side of the nonresidential building market increased 7% in March, showing improvement after a 10% drop in February. Office construction climbed 41%, lifted by the start of five projects valued each in excess of $100 million. These were led by the $525 million East Campus Building 2 at the U.S. Army installation at Fort Meade, Md., the $289 million LG corporate headquarters in Englewood Cliffs, N.J., and a $228 million office building in Seattle, Wa. Commercial garages also advanced in March, rising 12%.
In contrast, March witnessed declines for hotels, down 7%; stores and shopping centers, down 8%; and warehouses, down 14%. The manufacturing plant category in March plunged 65%, after being lifted in February by the start of a $985 million refinery modernization in Richmond, Ca.
 “While the construction-start statistics will frequently show an up-and-down pattern, whether month-to-month or quarter-to-quarter, the improved activity in this year’s first quarter provides evidence that the construction expansion is still proceeding,” said Robert A. Murray, Dodge chief economist.Dodge Data & Analytics
By geography, total construction starts in the first three months of 2017 showed reduced activity relative to last year in two regions – the South Central, down 26%; and the Northeast, down 3%. Total construction gains year-to-date were reported in the West, up 1%; the South Atlantic, up 11%; and the Midwest, up 12%.
Further perspective comes from looking at twelve-month moving totals, in this case the twelve months ending March 2017 versus the twelve months ending March 2016. On this basis, total construction starts were up 2%. By major sector, nonbuilding construction decreased 8%, with electric utilities/gas plants down 40% while public works increased 6%. Residential building rose 3%, as a 4% drop for multifamily housing was outweighed by a 7% gain for single family housing. Nonresidential building advanced 7%, with institutional building up 14%, commercial building up 7%, and manufacturing building down 26%.