For the first time since the start of the pandemic, the Architecture Billings Index (ABI) achieved a positive score, according to the latest Architecture Billings Index released by The American Institute of Architects (AIA). The ABI is an economic indicator for nonresidential construction activity, with a lead time of approximately nine to 12 months. It is used as a leading monthly economic indicator to assess business conditions and predict and track the market.
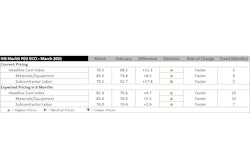
The February report maintains the momentum of the nearly three-point bump seen in the previous month, coming in at an ABI score of 53.3, a substantial rise compared to January's 44.9 and the first positive score since February 2020. A score above 50 indicates an increase in billings and is an indication that more construction projects are moving into the planning stages.
February also marked the first time the design contract score rose back into positive territory since the pandemic began, with a score of 51.6 compared to 48.8 in January. New project inquiries rose for the third month in a row, achieving a 22-month high with a score of 61.2 vs. 56.8 reported in the previous month.
“Hopefully, this is the start of a more sustained recovery. It is possible that scores will continue to bounce above and below 50 for the next few months, as recoveries often move in fits and starts,” said AIA Chief Economist Kermit Baker, Hon. AIA, PhD. “Beyond the encouraging billing data, architecture employment added 700 new positions in January and has now regained 45% of the jobs that were lost since the beginning of the pandemic.”
Additional ABI highlights for February include:
- Regional averages: South (52.4); West (49.5); Midwest (49.3); Northeast (46.9)
- Sector index breakdown: mixed practice (52.5); commercial/industrial (50.5); multi-family residential (48.3); institutional (47.8)
The regional and sector categories are calculated as a three-month moving average, whereas the national index, design contracts and inquiries are monthly numbers.
Information provided by The American Institute of Architects and edited by Becky Schultz.