- Both single-family (4.2%) and multifamily (2.4%) starts improved during the month.
- Building permits slipped 3.0%, with declines in single-family and multifamily permitting.
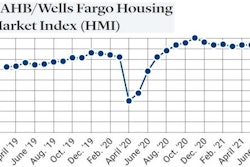
- The NAHB/Wells Fargo Housing Market Index fell two points to 81 in June.
Total U.S. housing starts in May jumped 3.6% to a 1.57-million-unit seasonally adjusted annual pace, according to monthly data released by the U.S. Commerce Department. In recent months, housing starts have drifted down off highs seen earlier in the year.
“However, builders continue to push through the headwinds of soaring building material costs and supply chain constraints in order to meet robust demand for single-family homes, townhomes, condos and apartments,” according to Charlie Dougherty, economist at Wells Fargo Securities. “On a year-to-date basis, housing starts are running 25.1% above prior year levels.”
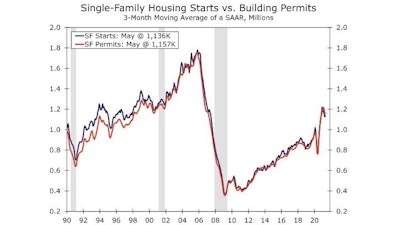
Single-family completions declined in both April and May, and single-family building permits fell 1.6%, the second straight monthly decline.
With multifamily construction’s 2.4% May growth, the segment is now up 12.1% year-to-date. But multifamily permits fell 5.8% during May.
Long lead times and sharply higher building materials prices are weighing on builder confidence. The National Association of Home Builders/Wells Fargo Housing Market Index (HMI) fell two points to 81 in June. Soaring material costs have translated to a rapid rise in new home prices, which has been pushing some prospective home buyers to the sidelines. Builder sentiment regarding the sales environment, both present and over the next six months, declined during the month, and prospective buyer traffic fell two points to 71.
Despite the monthly drop, the index of builder confidence remains above 80 which is still elevated compared to recent history. “Ongoing strength in the HMI suggests single-family construction will remain strong, despite persistent supply-side challenges,” says Dougherty.
In fact despite COVID-19, work started on 1.38 million homes in 2020, the best year since 2006. More than 990,000 of those were single-family homes, and at the seasonally adjusted annual rate the U.S. Commerce Department estimated for May, builders will start 1.57 million single-family homes this year.
Just over 389,000 apartment units began construction in 2020. There were bigger years than that in 2015, 2016 and 2019, but before them you have to go back to 1988 for a year in which more multifamily units were started. At the seasonally adjusted annual rate the U.S. Commerce Department estimated for May, builders will start 465,000 total multifamily units before 2021 is over.
All of this home building hasn’t helped close the nation’s housing shortage, which swelled to 3.8 million units, according to Freddie Mac, up from 2.5 million units in 2018. The underlying problems were only exacerbated during the pandemic.
“The inequalities amplified by the COVID-19 pandemic remain front and center,” wrote the authors of the State of the Nation's Housing 2021 report, released earlier this week. Inequalities include shortages of housing near jobs, affordable housing and starter homes, as well widening racial inequalities around ownership, access and wealth.
There was a striking rise in home sales during the pandemic. Existing-homes sales were up an average of 20% from September 2020 through February 2021, and new single-family home sales rose 20.4% in 2020. Coincident restrictions on supply of lots, building materials and labor building ushered in dramatic price increases. The Wall Street Journal reported in late May that the median price of a new home sold in April was $372,400, up 20.1% from a year earlier, the strongest annual gain since 1988. The median sales price for existing homes rose 19.1% in April to $341,600.
This dynamic brought immense increases in wealth to existing homeowners, who often took advantage of record-low interest rates to drive record levels of mortgage refinancing and slash their monthly payments. Meanwhile, desperate buyers watched the cost of down payments climb out of reach.
“In effect, the COVID housing market comforted the comfortable,” according to reporting on the State of the Nation's Housing 2021 this week by Bloomberg. “An ‘acute shortage of homes for sale’ mirrored an explosion in second-home sales.”
The average price-to-income ratio, a measure of an area’s median home costs versus its median income, hit 4.4 last year, the highest since 2006, with 23 markets hitting 5.0. In San Jose, that ratio stood at 10.9, the highest in the country.
Longstanding inequities like the Black-white homeownership gap, which hit a 30-year high in 2019, have been worsened by the pandemic, according to Daniel McCue, a senior research associate at the Harvard Joint Center for Housing Studies, reported by Bloomberg. So has the generation gap: Between 2016 and 2019, the number of Boomer homeowners grew by 800,000 annually, more than the 500,000 annual increase of all other generations combined.