ConstructConnect announced today that June’s volume of construction starts, excluding residential activity, was $39.8 billion — a month-to-month change of -24.7%. The one-quarter drop was not due to market conditions. Rather, the comparison of June versus May suffered from the latter including Foxconn Technology’s $10 billion industrial plant in Wisconsin. June relative to May exclusive of that single mega project was still down, but by only -7.2%. The historical May-to-June change, aided by favorable ‘seasonality’, has been +4.5%.
June 2018 versus the same month of last year was -6.3%. June 2018 versus the five-year average for June, from 2013 through 2017, was +3.2%
Year-to-date starts in 2018, compared with first half (H1) 2017 starts, have been -5.5%.
The starts figures throughout this report are not seasonally adjusted (NSA). Nor are they altered for inflation. They are expressed in what are termed ‘current’ as opposed to ‘constant’ dollars.
Nonresidential building plus engineering/civil work accounts for a larger share of total construction than residential activity. The former’s combined proportion of total put-in-place construction in the Census Bureau’s April report was 57%; the latter’s share was 43%.
ConstructConnect’s construction starts are leading indicators for the Census Bureau’s capital investment or put-in-place series. Also, the reporting period for starts (i.e., June 2018) is one month ahead of the reporting period for the investment series (i.e., May 2018.)
June 2018’s increase in construction employment, as recorded in the latest Employment Situation report from the Bureau of Labor Statistics (BLS), was 13,000 jobs. Among sub-sectors of construction, it was heavy and civil engineering work that saw the largest month-to-month pickup in hiring, 6,000 jobs. The average monthly climb in staffing by the construction sector through H1 of this year has been 25,000, a decent gain (+25%) over last year’s comparable figure of 20,000.
Construction jobs are now +4.1% year over year, a rate of improvement that is more than two-and-a-half times greater than the +1.6% advance for all jobs in the nation. The BLS report also includes employment results for the following additional pockets of the economy with close ties to construction:
- architectural and engineering services, +3.1%;
- building material and garden supply stores, +3.7%
- real estate, +2.1%
- oil and gas extraction, +3.9%
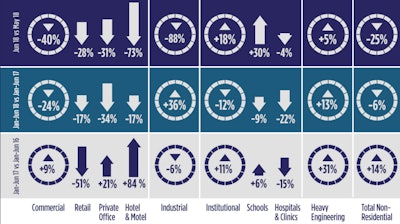
Most of the -24.7% retreat in total nonresidential starts month to month (m/m) in June originated in the industrial subcategory (-87.7%). There were no projects in June’s manufacturing starts that could compete with May’s $10 billion Foxconn insertion. Commercial (-40.4%) was also down, but institutional (+18.0%) and engineering (+4.5%) perked up.
The -6.3% step back in June 2018’s total nonresidential starts, versus June 2017 (y/y), was due to declines in the commercial (-36.9%) and institutional (-6.3%) type-of-structure subcategories that weren’t quite matched by industrial (+11.3%) and heavy engineering/civil (+26.5%) uplifts.
There was a similar pattern for year-to-date (ytd) total non-residential starts. The fact that January-to-June 2018 total nonresidential starts were -5.5% relative to January-June 2017 (i.e., H1 2018/H1 2017) resulted from weakness in commercial (-23.7%) and institutional (-12.3%) that was not quite offset by strength in industrial (+35.8%) and heavy engineering (+13.4%).
Within the commercial type-of-structure category, the four major sub-headings by share of total in June were hotel/motel (a 22% slice ytd), private office (19%), warehouse (15%) and retail/shopping (14%). For all those stalwarts, their latest percentage-change numbers were gloomy. Hotel/motel starts in June were -72.6% m/m; -38.3% y/y; and -17.0% ytd.
Private office work was -31.0% m/m; -73.9% y/y; and -34.2% ytd. Warehouse was -63.5% m/m; -51.3% y/y; and -16.7% ytd. Retail/shopping was -27.7% m/m; -46.8% y/y; and -16.7% ytd.
Miscellaneous commercial in June, however, did manage to deliver some good news. While being -42.6% ytd, it was +23.8% y/y and +92.7% m/m. This category includes transportation terminal work, which was +60.9% ytd. The passenger side of airport construction appears here, with runways in civil. Nashville has been the latest city with large airport terminal work.
Institutional starts so far in 2018 have been dominated by the school/college subcategory, which in June was -8.9% ytd and -3.9% y/y, but +30.4% m/m. Providing deeper granularity, the H1 2018/H1 2017 results were: -2.9% for elementary/pre-school; +4.1% for junior/senior high school; +3.5% for special vocational schools; and -28.6% for college/ university starts.
Medical facility work has a large supporting role in institutional starts. Hospital/clinic, nursing/assisted living and miscellaneous medical combined for a 28% share of institutional in June. The biggest of those three, hospital/clinic, was -4.1% m/m; -8.5% y/y; and -22.2% ytd.
In engineering starts, it’s the road/highway (a 37% share ytd) and miscellaneous civil (23%) subcategories that have been leading the way. In June, the former was -4.2% m/m; +7.8% y/y; and +7.5% ytd, while the latter — which includes railways and subways as well as electric power plants and oil and gas pipelines — was +147.2% m/m; +154.5% y/y; and +112.7% ytd. Rapid transit work in L.A. stands out in June’s Top 10 list.
The average annual compensation increases in June 2018 for all jobs nationally were +2.7% hourly and +3.0% weekly. Construction workers as a sub-set, however, made pay check headway faster, at +2.9% hourly and +3.5% weekly. The all jobs earnings gains were +2.7% hourly and +3.0% weekly. Once again, though, workers with construction firms realized wage increases that were more rewarding, +3.5% hourly and +4.3% weekly.
The value of construction starts each month is summarized from ConstructConnect’s database of all active construction projects in the U.S. Missing project values are estimated with the help of RSMeans’ building cost models.
ConstructConnect’s nonresidential construction starts series, because it is comprised of total-value estimates for individual projects, some of which are ultra-large, has a history of being more volatile than many other leading indicators for the economy.