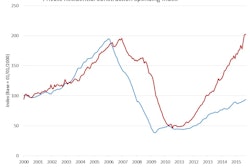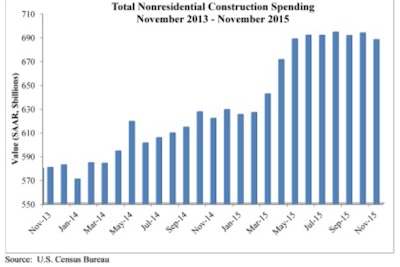
Nonresidential construction spending dipped by 0.8% in November, totaling $688.1 billion on a seasonally adjusted, annualized basis, according to an Associated Builders and Contractors (ABC) analysis of U.S. Census Bureau data. This represents the worst monthly performance since April 2015. Moreover, October’s spending estimate was revised downward from $701.8 billion to $693.7 billion and September’s estimate was revised downward from $695 billion to $691.5 billion.
Overall, 12 of the 16 nonresidential subsectors experienced spending decreases in November as spending declined in both the private (-0.7%) and public sectors (-1%).
“While it is rarely a good idea to place too much emphasis on one month of data, there are some ominous indications in today’s report,” said ABC Chief Economist Anirban Basu. “After experiencing significant spending momentum early last year, that momentum has softened considerably in recent months. Recent surveys of construction executives have been a bit more downbeat of late.
“Economic news generally has not been very positive with the glaring exception of the U.S. labor market, often viewed as a lagging economic indicator. Profit margins at many companies are being squeezed by rising wage and healthcare costs, and the losses experienced by energy suppliers have been well chronicled. Softer global economic growth and a stronger U.S. dollar are also making their mark. The world suddenly feels considerably riskier. That frequently translates into diminished capital availability, which ultimately translates into weaker construction spending.
“ABC has noted previously that construction backlog is not expanding as it had earlier in the cycle,” continued Basu. “The most recent data suggest that while 2016 may be a year of nonresidential construction spending growth, it may not provide the degree of momentum that characterized much of 2015. It is worth noting that construction related to the nation’s manufacturing sector slipped meaningfully in November, likely a reflection of falling exports and stiffer competition from foreign producers. Even healthcare-related construction spending slipped, but there is reason to believe that it will be an important driver of overall construction spending growth this year.
Only four of 16 nonresidential construction sectors experienced spending increases in November on a monthly basis:
- Spending in the communication category increased by 4.4% for the month and is up 27.8% on a yearly basis.
- Spending in the educational category rose 3.9% month-over-month and has expanded 13.8% year-over-year.
- Office-related spending increased 1.6% from October 2015 and 20.6% from November 2014.
- Spending in the transportation category inched up 0.2% for the month and is up 3.1% for the year.
Spending in 12 of the nonresidential construction subsectors fell in November on a monthly basis:
- Spending in the public safety category fell 8.1% on a monthly basis and 5.2% on a yearly basis.
- Water supply-related spending fell 7.2% month-over month and 5.2% year-over-year.
- Spending in the conservation and development category dipped 4.9% for the month, but rose 3.2% compared to November 2014.
- Sewage and waste disposal-related spending fell 4.8% from October 2015 and 1.8% from November 2014.
- Manufacturing-related spending dipped 4.2% month-over-month, but is up 28.8% year-over-year.
- Spending in the religious category fell 3.8% for the month, but is up 3.4% compared to the same time last year.
- Amusement and recreation-related spending shed 2.1% on a monthly basis, but has gained 16.2% on a yearly basis.
- Highway and street-related spending dipped 1.4% for the month, but is up5.5% from November 2014.
- Spending in the lodging category fell 1.1% month-over-month, but is 28.6% higher than at the same time last year.
- Commercial-related spending dipped 1.1% on a monthly basis, but has expanded 0.4% on a yearly basis.
- Spending in the power category declined 1.1% for the month, but is up 5.2% for year-over-year.
- Health care related spending ticked down 0.1% from October 2015, but has expanded 5% since November 2014.