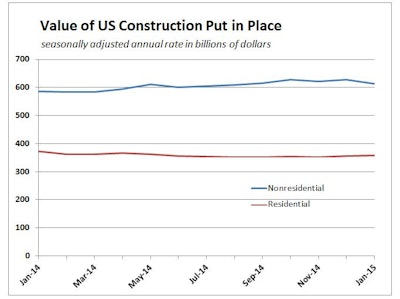
Nonresidential construction spending fell 2% in January, which is the largest setback to spending since January 2014, according to estimates reported March 2 by the U.S. Census Bureau. However, at $614.1 billion on a seasonally adjusted, annualized basis, nonresidential construction spending is 4.8% higher than one year ago.
"Interpreting January construction statistics is always tricky because the seasonal adjustments can never precisely reflect the impact of any given winter or weather system," said Associated Builders and Contractors Chief Economist Anirban Basu. "New England, among other places, was hit heavily by snow in January and this could explain the monthly decline in nonresidential construction spending.
"Additionally, nonresidential construction spending enjoyed positive momentum through the end of 2014 and, until January, had registered spending growth in five of the previous six months," Basu said. "It is also possible that the West Coast port slowdown impacted construction volumes, including by reducing material availability."
Three of 16 nonresidential construction subsectors posted increases in spending in January on a monthly basis:
- Communication construction spending gained 0.7% for the month, but is down 1.5% for the year
- Highway- and street-related construction spending grew 0.2% in January and is up 8.7% compared to the same time last year
- Manufacturing-related spending expanded by 4% in January and is up 22.5% for the year
Spending in 13 nonresidential construction subsectors declined in January:
- Health care-related construction spending fell 2.3% for the month and is down 2.5% for the year
- Education-related construction spending fell 3.6% for the month and 0.4% on a year-over-year basis
- Spending in the water supply category dropped 7.5% from December, but is 3.3% higher than at the same time last year
- Construction spending in the transportation category fell 1.7% on a monthly basis, but has expanded 8.9% on an annual basis
- Public safety-related construction spending declined 6.7% on a monthly basis and is down 14.5% on a year-over-year basis
- Commercial construction spending decreased 5.7% in January, but is up 14% on a year-over-year basis
- Religious spending fell 11.4% for the month and is down 12.4% compared to the same time last year
- Lodging construction spending is down 4.4% on a monthly basis, but is up 18.2% on a year-over-year basis
- Sewage and waste disposal-related construction spending shed 7.5% for the month, but has grown 16% on a 12-month basis
- Power-related construction spending fell 1.1% for the month and is 13.2% lower than at the same time one year ago
- Conservation and development-related construction spending fell 5.1% for the month but is up 25.6% on a yearly basis
- Office-related construction spending declined 1.7% in January but is up 13.7% from the same time one year ago
- Amusement and recreation-related construction spending fell 3.2% on a monthly basis but is up 19.3% from the same time last year
- Sewage and waste disposal-related construction spending fell 2% for the month, but has grown 10.5% on a 12-month basis
Total U.S. construction spending in January was estimated at a seasonally adjusted annual rate of $971.4 billion, 1.1% below the revised December estimate of $982.0 billion. The January figure is 1.8% above January 2014's $954.6 billion.