Did you know that motorists encounter an active work zone one out of every 100 miles they drive? That equates to 12 billion vehicle miles traveled each year through active work zones. These huge numbers increase the desire to manage and mitigate the costs associated with construction and work zones.
According to Jeff LaMondia, PhD, associate professor, department of engineering program chair at Auburn University, there are three main costs associated with an active work zone and his team used these cost categories to create a tool that will help contractors and project planners calculate cost impacts.
“Inherently we are already aware of these costs,” LaMondia says. “We think about them when we start planning for work zones. It’s why we think about when we have construction, how long we keep the work zone open. We are aware people are impacted by what we do in work zones we just need to quantify those costs.”
Three Costs
To quantify costs, the team at Auburn conducted extensive research on these three main areas.
Road User Costs (RUCs): RUCs are costs experienced by personal and freight vehicles traveling throughout work zones. These are total monetary and temporal costs we associate with traffic delays and other challenges drivers encounter in a work zone.
Calculating the cost of using the roadways can be quantified in many ways. RUC’s: Road User Costs for each vehicle in a work zone are most often described using the following equation: RUC𝑖 = LTC𝑖 + OC𝑖 + EC𝑖
Where:
RUC𝑖 = Road User Costs for vehicle i
LTC𝑖 = Lost Time Cost for vehicle (personal and business time lost when traveler are delayed)
OC𝑖 = Operating Cost for vehicle (costs related to idling a vehicle during a work zone traffic delay)
EC𝑖 = Emissions Cost for vehicle (costs incurred on the environment through air pollutants due to additional travel time)
Each section calculates the RUC in total dollars per day for any given work zone based on lost time costs, operating costs and emission costs. These RUCs can be calculated for each individual vehicle and summed for the entire volume of traffic that passes through the work zone.
“For every minute you are driving on the roadway, there is actually a value of time associated with it,” LaMondia says. “There are many factors that impact those costs, but as the time spent on the roadway increases, so does the cost.”
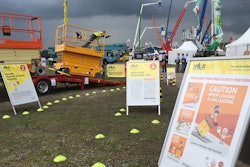
Work Zone Crash Mitigation Costs (CMCs): A work zone crash occurs in the United States every 5.4 minutes, making crash mitigation an important part of any work zone plan.
CMCs are defined as the cost associated with the most likely crash type to occur at a work zone. This section calculates a total dollar per project duration crash mitigation cost for any given work zone based on the most likely crash to occur at the specified location.
“In order to calculate the cost of a crash, we actually needed to look at crashed that have happened in a work zone,” LaMondia says. “We went to the Highway Safety Information System and the Alabama Crash Database. With only eight states represented, we had over 89,000 crashes to look at.”
Crashes and costs are evaluated using the FHWA’s KABCO scale (outlined in Table 1). This scale designates five types of crashes that can occur within a work zone, on a severity scale from property damage only (PDO) to fatal crash (K).
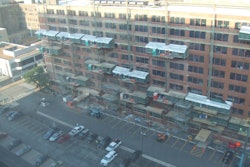
Local Business Impact Costs (LBICs): These are the economic impacts to local businesses around the work zone that are caused by reduced access to the location, resulting in changes in customer spending and visitation behaviors.
“Despite being a well-documented challenge, there is very little actual data on how businesses are hurt by construction beyond anecdotal evidence,” LaMondia says. “So we collected the data ourselves.”
A national survey was conducted to determine customer preferences to different work zone durations as it related to their activity choices. The national LBIC survey was conducted through the Survey Monkey platform to limit costs and maximize the sample size. Originally, 425 responses were recorded then another 345 responses were solicited during the ensuing phases. Respondents were chosen to reflect US Census demographics and socioeconomic factors to allow a representative sample of the entire nation.
Questions covered consumer spending habits among different activities (leisure, grocery shopping, home/houseware shopping), average travel times to said activities and behavioral changes to travel if a work zone of variable durations is introduced to the trip.
In this section then, LBICs were calculated in total dollars per day for any given work zone based on a likely avoidance behavior of each simulated highway traveler.
“If you’re able to use data to communicate with business owners or planning organizations and show them a few plans on what would work best, it’s a great way to mitigate costs and improve relationships with the potential customers.”
Quantifying Costs
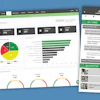
Using all of this data, LaMondia and his team developed the Pavement Rehabilitation Project Cost Tool (PRPC) that is designed to help work zone designers quantify the impact a work zone has on these three main areas by deploying different techniques that mitigate and minimize delay and cost.
The tool provides contractors and agencies with the ability to calculate costs associated with a roadway rehabilitation project. The tool only requires users to collect and enter information about the roadway, surrounding area and work zone. The result is a spreadsheet that calculates the impact costs once the user clicks the “calculate” button.
The Excel Workbook consists of five tabs: Work Zone Characteristics, Vehicle Simulation, Regional Demographics, Crash Costs and Reference Tables. Only the Work Zone Characteristics tab requires data input to use the tool effectively; the other tabs illustrate the methodology and statistics used to compute the end results.
With this tool, LaMondia says there are three main things we can do with this quantified information.
1. Evaluate the Project: Look at project and complete a cost-benefit analysis on each proposed plan, schedule, material, work zone layout, etc.
2. Plan the Project: Evaluate possible innovative scheduling opportunities in relation to overall budget and regional impacts.
3. Communicate to the Community: Illustrate potential loss (or lack of loss) to local business owners and decision-makers.
“If you’re able to quantify how a project is going to impact traffic, the community and address potential crashes, that’s a great way to justify selecting one bid over another,” he concludes.