- Record-long raw-materials lead times reported
- Shortages of critical basic materials
- Rising commodities prices and
- Difficulties in transporting products
- COVID-19 surges have led to worker absenteeism, short-term shutdowns, parts shortages, unfilled positions and overseas supply chain problems
- Port congestion in China continues to be an issue
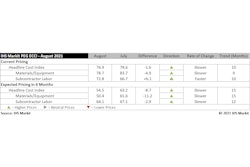
- Cement prices increased
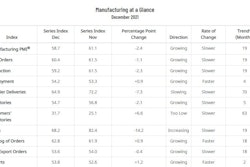
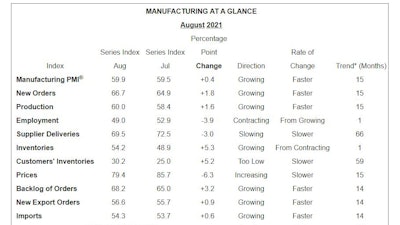
Economic activity in the manufacturing sector grew in August, with the overall economy notching a 15th consecutive month of growth, say the nation's supply executives in the latest Manufacturing ISM Report on Business.
The report was issued Sept. 1 by Timothy R. Fiore, chair of the Institute for Supply Management (ISM) Manufacturing Business Survey Committee. The Manufacturing PMI, or the Purchasing Managers’ Index, is a set of economic indicators based off surveys of private-sector companies.
“The August Manufacturing PMI registered 59.9%, an increase of a 0.4 percentage point from the July reading of 59.5%. This figure indicates expansion in the overall economy for the 15th month in a row after contraction in April 2020,” he says.
The New Orders Index registered 66.7%, increasing 1.8 percentage points from the July reading of 64.9%. The Production Index registered 60%, an increase of 1.6 percentage points compared to the July reading of 58.4%.
The Prices Index registered 79.4%, down 6.3 percentage points compared to the July figure of 85.7%; this is its first reading below 80% since December 2020 (77.6%).
The Backlog of Orders Index registered 68.2%, 3.2 percentage points higher than the July reading of 65%. The Employment Index indicated contraction at 49%, 3.9 percentage points lower compared to the July reading of 52.9%.
The Supplier Deliveries Index registered 69.5%, down 3 percentage points from the July figure of 72.5%. The Inventories Index registered 54.2%, 5.3 percentage points higher than the July reading of 48.9%.
The New Export Orders Index registered 56.6%, an increase of 0.9 percentage point compared to the July reading of 55.7%. The Imports Index registered 54.3%, an 0.6- percentage point increase from the July reading of 53.7%.
“Business Survey Committee panelists reported that their companies and suppliers continue to struggle at unprecedented levels to meet increasing demand,” Fiore says. “All segments of the manufacturing economy are impacted by record-long raw-materials lead times, continued shortages of critical basic materials, rising commodities prices and difficulties in transporting products. The new surges of COVID-19 are adding to pandemic-related issues — worker absenteeism, short-term shutdowns due to parts shortages, difficulties in filling open positions and overseas supply chain problems — that continue to limit manufacturing-growth potential.”
What Industry Execs are Saying
Manufacturing executives continue to report a positive business outlook despite theses challenges.
“Panel sentiment remained strong, with eight positive comments for every cautious comment. Demand expanded, with the New Orders Index growing, supported by continued expansion of the New Export Orders Index, Customers' Inventories Index remaining at very low levels and Backlog of Orders Index staying at a very high level,” Fiore says. “Consumption (measured by the Production and Employment indexes) declined in the period, with a combined 2.3-percentage point decrease to the Manufacturing PMI calculation. The Employment Index returned to contraction after one month of expansion; hiring difficulties at panelists' companies were the most significant hurdle to further output in August, as validated by the growth in inventory accounts.”
Inputs — expressed as supplier deliveries, inventories, and imports — continued to support input-driven constraints to production expansion, at slower rates compared to July, he says. The Supplier Deliveries Index softened while the Inventories Index made a strong move into expansion territory due to improvements in raw material deliveries as well as work in progress inventory being held longer due to key part shortages. The Prices Index expanded for the 15th consecutive month, indicating continued supplier pricing power and scarcity of supply chain goods.
“All of the six biggest manufacturing industries — computer and electronic products; fabricated metal products; chemical products; food, beverage and tobacco products; transportation equipment; and petroleum and coal products, in that order — registered moderate to strong growth in August,” Fiore says.
"Manufacturing performed well for the 15th straight month, with demand, consumption and inputs registering month-over-month growth, in spite of unprecedented obstacles. Panelists' companies and their supply chains continue to struggle to respond to strong demand due to difficulties in hiring and a clear cycle of labor turnover as workers opt for more attractive job conditions. Disruptions from COVID-19, primarily in Southeast Asia, are having dramatic impacts on many industry sectors. Port congestion in China continues to be a headwind as transportation networks remain stressed. Demand remains at strong levels, despite increased prices for nearly everything.”
The 15 manufacturing industries reporting growth in August, in order, are: furniture and related products; computer and electronic products; machinery; primary metals; electrical equipment, appliances and components; fabricated metal products; plastics and rubber products; chemical products; miscellaneous manufacturing; food, beverage and tobacco products; transportation equipment; wood products; printing and related support activities; paper products; and petroleum and coal products. The two industries reporting a decrease in August compared to July are textile mills and nonmetallic mineral products.
The computer chip shortage is creating challenges for numerous sectors.
“The chip shortage is impacting supply lines,” says one business executive in computer and electronic products. “So far, we've been able to manage it without impacting clients.”
Supply chain disruptions are another ongoing headache.
“We continue to see extended lead times due to port delays and sea container tightness,” says an executive in chemical products. “Manufacturing capacities are impacted by a lack of workers reducing output. Several chemical facilities have experienced fires, explosions and spills, further challenging suppliers' ability to deliver on time and in full.”
Workforce shortages are impacting production in the fabricated metal products sector.
“(We) continue to be unable to hire hourly personnel or machine operators due to few applicants,” says one executive in the industry. “Steel and aluminum remain in short supply. New business continues to grow and come in. Unable to handle influx of orders without staff, both hourly and salaried.”
In the machinery sector a shortage of parts and the labor shortage are limiting production.
“Customer order backlog continues to climb because we are unable to raise production rates due to supplier parts and manpower challenges,” an industry executive says. “(We) continue to see price increases with key commodities and logistics is an ongoing challenge that has no end in sight.”
Commodities Up in Price
The following commodities have increased in price (the number of consecutive months the commodity is listed is indicated after each item): adhesives (two); aluminum (15); aluminum extrusions; aluminum products (five); capacitors (two); caustic soda (three); cement; copper-based products; corrugate (11); corrugated packaging (10); crude oil (three); diesel fuel (eight); electrical components (nine); electrical motors (two); electronic components (nine); freight (10); high-density polyethylene (eight); hydraulic components (two); labor - temporary (four); linear low-density polyethylene; lumber (14); natural gas (two); ocean freight (nine); packaging supplies (nine); pallets (two); plastic resins (12); polyethylene (seven); polypropylene (14); resin-based products (seven); resistors (two); rubber-based products; semiconductors (seven); soybean oil; steel (13); steel - carbon (nine); steel - cold rolled; steel - hot rolled (12); steel - scrap (four); steel - stainless (10); and steel products (12).
Commodities down in price include lumber and wood.
Commodities in Short Supply
Commodities in short supply include (the number of consecutive months the commodity is listed is indicated after each item): adhesives and paint (two); aluminum (five); aluminum products (four); cable assemblies; capacitors (two); corrugated packaging (two); electrical components (11); electronic components (nine); foam; hydraulic components (two); labor - temporary (four); lumber (two); metal components; ocean freight (five); plastic products (seven); plastic resins - other (six); polypropylene; printed circuit board assemblies; resin-based products; resistors (two); rubber-based products; semiconductors (nine); steel (nine); steel - hot rolled (10); steel - stainless (six); steel castings; and steel products (seven).
 ISM
ISM
Manufacturing PMI
Manufacturing grew in August, as the Manufacturing PMI registered 59.9%, 0.4 percentage point higher than the July reading of 59.5%.
“The Manufacturing PMI continued to indicate strong sector expansion and U.S. economic growth in August,” Fiore says. “Four out of five subindexes that directly factor into the Manufacturing PMI were in growth territory. All of the six biggest manufacturing industries expanded, in the following order: computer and electronic products; fabricated metal products; chemical products; food, beverage and tobacco products; transportation equipment and petroleum and coal products.”
The New Orders and Production indexes continued to expand at strong levels. The Supplier Deliveries Index continued to reflect suppliers' difficulties in maintaining delivery rates, due to a lack of direct labor, transportation challenges and sustained levels of increasing demand, he says.
Nine out of 10 subindexes were positive for the period; a reading of 'too low' for Customers' Inventories Index is considered a positive for future production, says Fiore. A reading above 50% indicates that the manufacturing economy is generally expanding; below 50% indicates that it is generally contracting.
A Manufacturing PMI above 43.1%, over a period of time, generally indicates an expansion of the overall economy. Therefore, the August Manufacturing PMI indicates the overall economy grew in August for the 15th consecutive month following contraction in April 2020.
“The past relationship between the Manufacturing PMI and the overall economy indicates that the Manufacturing PMI for August (59.9%) corresponds to a 4.8% increase in real gross domestic product (GDP) on an annualized basis," says Fiore.
 ISM PMI Manufacturing New OrdersISM
New Orders
ISM's New Orders Index registered 66.7% in August, up 1.8 percentage points compared to the 64.9% reported in July. This indicates that new orders grew for the 15th consecutive month.
“All of the six largest manufacturing sectors — computer and electronic products; food, beverage and tobacco products; petroleum and coal products; chemical products; transportation equipment; and fabricated metal products, in that order — expanded at strong levels,” Fiore says. “This is the 14th consecutive month of index readings of above 60, matching a 14-month streak during the last manufacturing expansion, which began in February 2016.”
A New Orders Index above 52.8%, over time, is generally consistent with an increase in the Census Bureau's series on manufacturing orders.
Of the 18 manufacturing industries, the 14 that reported growth in new orders in August, in order, are: furniture and related products; computer and electronic products; printing and related support activities; machinery; paper products; food, beverage and tobacco products; primary metals; plastics and rubber products; petroleum and coal products; chemical products; miscellaneous manufacturing; transportation equipment; fabricated metal products; and electrical equipment, appliances and components. The only industry reporting a decline in new orders in August is nonmetallic mineral products.

Production
The Production Index registered 60% in August, 1.6 percentage points higher than the July reading of 58.4%, indicating growth for the 15th consecutive month.
"All of the top six industries — computer and electronic products; chemical products; petroleum and coal products; fabricated metal products; food, beverage and tobacco products and transportation equipment, in that order — expanded at strong to moderate levels,” Fiore says. “Raw materials continued to be a constraint to production growth, but less so compared to July, as raw-materials inventories reached their highest levels in this cycle. Persistent hiring issues continue.”
An index above 52.1%, over time, is generally consistent with an increase in the Federal Reserve Board's Industrial Production figures.
The 13 industries reporting growth in production during the month of August, in order, are: furniture and related products; wood products; printing and related support activities; computer and electronic products; electrical equipment, appliances and components; chemical products; petroleum and coal products; machinery; fabricated metal products; primary metals; food, beverage and tobacco products; miscellaneous manufacturing; and transportation equipment. The four industries reporting a decrease in August compared to July are: textile mills; nonmetallic mineral products; paper products; and plastics and rubber products.
 ISM PMI Manufacturing EmploymentISM
Employment
ISM's Employment Index registered 49% in August, 3.9 percentage points below the July reading of 52.9%.
“The Employment Index returned to contraction territory after one month above 50%,” Fiore says. “Of the six big manufacturing sectors, three (computer and electronic products; fabricated metal products; and transportation equipment) expanded.”
Strong new-order levels, low customers' inventories and expanding backlogs belied the reduction in employment strength. Survey panelists' companies are still struggling to meet labor-management plans, but despite a contracting index, there were positive signs compared to recent months: an overwhelming majority of panelists indicate their companies are hiring or attempting to hire, with about 35% of comments — a decrease from previous months — expressing difficulty in filling positions, Fiore says.
“A significant number of panelists note increasing employee-turnover rates, continuing a trend evident in the comments in July,” he says.
An Employment Index above 50.6%, over time, is generally consistent with an increase in the Bureau of Labor Statistics (BLS) data on manufacturing employment.
Of the 18 manufacturing industries, the seven reporting employment growth in August, in order, are: electrical equipment, appliances and components; furniture and related products; primary metals; computer and electronic products; machinery; fabricated metal products; and transportation equipment. The seven industries reporting a decrease in employment in August, in order, are: textile mills; paper products; printing and related support activities; nonmetallic mineral products; petroleum and coal products; food, beverage and tobacco products; and chemical products.
 ISM PMI Manufacturing Supplier DeliveriesISM
Supplier Deliveries
The delivery performance of suppliers to manufacturing organizations was slower in August, as the Supplier Deliveries Index registered 69.5%, 3 percentage points lower than the 72.5% reported in July and the third straight month of slowing expansion.
Of the six top manufacturing industries, five (fabricated metal products; food, beverage and tobacco products; computer and electronic products; chemical products; and transportation equipment) reported slowing deliveries.
“Deliveries slowed at a slower rate compared to the previous month, but the index continues to reflect suppliers' difficulties in meeting customer demand, including ongoing hiring challenges, extended raw-materials lead times at lower tiers and stubbornly high prices, and inconsistent transportation availability,” says Fiore.
A reading below 50% indicates faster deliveries, while a reading above 50% indicates slower deliveries.
The 16 industries that reported slower supplier deliveries in August, in order, are: apparel, leather and allied products; textile mills; furniture and related products; paper products; machinery; fabricated metal products; miscellaneous manufacturing; printing and related support activities; food, beverage and tobacco products; computer and electronic products; electrical equipment, appliances and components; plastics and rubber products; chemical products; primary metals; nonmetallic mineral products; and transportation equipment.
 ISM PMI Manufacturing InventoriesISM
Inventories
The Inventories Index registered 54.2% in August, 5.3 percentage points higher than the 48.9% reported for July, returning to expansion territory after one month of contraction.
“Inventories remain unstable due to ongoing supplier constraints, as demonstrated by the index returning to expansion,” Fiore says. “In August, supplier delivery rates exceeded production levels, causing inventory levels to increase. This is a positive indication that the supply chain is finally making headway. There may also be an effect of work in progress inventory (WIP) becoming a larger percentage of total inventory due to slower WIP cycle times. Computer and electronic products and transportation equipment are notable contributors to significant gains in Inventory levels in part due to part shortage issues. This is the highest level of inventories expansion since November 2018, when the index registered 54.4%.”
An Inventories Index greater than 44.5%, over time, is generally consistent with expansion in the Bureau of Economic Analysis (BEA) figures on overall manufacturing inventories.
The 10 industries reporting higher inventories in August, in order, are: plastics and rubber products; furniture and related products; primary metals; fabricated metal products; computer and electronic products; chemical products; transportation equipment; machinery; food, beverage and tobacco products; and miscellaneous manufacturing. The two industries reporting a decrease in inventories in August are apparel, leather and allied products; and printing and related support activities. Six industries reported no change in inventories in August compared to July.
Customers' Inventories
ISM's Customers' Inventories Index registered 30.2% in August, 5.2 percentage points above the 25% reported for July, indicating that customers' inventory levels were considered too low.
“Customers' inventories are too low for the 59th consecutive month, a positive for future production growth,” Fiore says. “For 13 straight months, the Customers' Inventories Index has been at historically low levels.”
No industries reported higher customers' inventories in August. The 15 industries reporting customers' inventories as too low during August, in order, are: nonmetallic mineral products; textile mills; primary metals; furniture and related products; machinery; miscellaneous manufacturing; chemical products; paper products; wood products; food, beverage and tobacco products; fabricated metal products; computer and electronic products; plastics and rubber products; electrical equipment, appliances and components; and transportation equipment.
Prices
The ISM Prices Index registered 79.4%, a decrease of 6.3 percentage points compared to the July reading of 85.7%, indicating raw-materials prices increased for the 15th consecutive month, but at slower levels.
“Aluminum, electrical and electronic components, energy, some plastics and plastic products, freight, and steels continue to remain at elevated prices due to product scarcity, but supply and demand dynamics appear to be moving closer to equilibrium, as stated in recent months,” says Fiore.
A Prices Index above 52.7%, over time, is generally consistent with an increase in the Bureau of Labor Statistics (BLS) Producer Price Index for Intermediate Materials.
In August, 16 of 18 industries reported paying increased prices for raw materials, in the following order: apparel, leather and allied products; plastics and rubber products; printing and related support activities; nonmetallic mineral products; fabricated metal products; furniture and related products; paper products; machinery; transportation equipment; electrical equipment, appliances and components; primary metals; computer and electronic products; miscellaneous manufacturing; chemical products; wood products; and food, beverage and tobacco products. The only industry reporting a decline in prices in August is petroleum and coal products.
 ISM PMI Manufacturing BacklogISM
Backlog of Orders
ISM's Backlog of Orders Index registered 68.2% in August, a 3.2- percentage point increase compared to the 65% reported in July, indicating order backlogs expanded for the 14th straight month.
“Backlogs expanded at a higher rate in August compared to July, indicating production was unable to keep up with continuing strong new order levels. Of the six big industry sectors, five (food, beverage and tobacco products; computer and electronic products; transportation equipment; chemical products; and fabricated metal products) reported that backlogs expanded strongly," says Fiore.
The 15 industries reporting growth in order backlogs in August, in the following order, are: apparel, leather and allied products; textile mills; furniture and related products; printing and related support activities; machinery; food, beverage and tobacco products; computer and electronic products; miscellaneous manufacturing; plastics and rubber products; paper products; electrical equipment, appliances and components; transportation equipment; chemical products; fabricated metal products; and primary metals. No industry reported lower backlogs in August compared to July.
New Export Orders
ISM's New Export Orders Index registered 56.6% in August, up a 0.9 percentage point compared to the July reading of 55.7%.
“The New Export Orders Index grew for the 14th consecutive month, at a slightly faster rate compared to July,” Fiore says. “Of the six big industry sectors, five (computer and electronic products; food, beverage and tobacco products; chemical products; transportation equipment; and fabricated metal products) expanded. New export orders were again a positive factor to the growth in the New Orders Index.”
The eight industries reporting growth in new export orders in August, in order, are: furniture and related products; computer and electronic products; paper products; food, beverage and tobacco products; miscellaneous manufacturing; chemical products; transportation equipment; and fabricated metal products. The two industries reporting a decrease in new export orders in August are plastics and rubber products and machinery. Seven industries reported no change in exports in August compared to July.
Imports
ISM's Imports Index registered 54.3% in August, an increase of a 0.6 percentage point compared to July's figure of 53.7%.
“Imports expanded for the 14th consecutive month, at a somewhat faster rate compared to July, reflecting continuing challenges with throughput at U.S. ports of entry,” Fiore says. “Overland-transport challenges and container shortages continue to persist across the global supply chain, causing major stability issues with respect to predictable import levels. Imports will continue to be challenged through the end of 2021.”
The eight industries reporting growth in imports in August, in order, are: chemical products; primary metals; computer and electronic products; furniture and related products; transportation equipment; food, beverage and tobacco products; plastics and rubber products; and machinery. the three industries reporting a decrease in imports in august are wood products; paper products; and miscellaneous manufacturing. Seven industries reported no change in imports in August compared to July.