Most employees want to know how they are doing and how they are performing. Likewise, crews and departments of people often have the same interest. Creating a "Team Scoreboard"suggests identifying the top three to five (or even as many as seven) performance measurements that best reflect how the group, team or crew is doing. No different than the dashboard in your vehicle that provides some measurements of how well your car or truck is performing, so too does the team scorecard provide such monitoring. The Team Scoreboard can be developed for construction crews, project teams, departments, companies and production lines.
Let’s discuss three important components to building the team scoreboard — and one component on gaining the employee’s interest.
- What performance indicators should be selected?
- How are selected performance indicators to be measured?
- How should the measurements be reflected or captured on the team scoreboard?
- How do you gain the employee’s interest to respond to the team scoreboard?
What performance indicators should be selected?
This first component is totally dependent on your area of work. If you are constructing a scoreboard for your crews what are the most important indicators of their success? Consider just a few measurements that might be critical to know, including:
- Sales/revenue
- Costs/expenses
- Equipment operations
- Amount of work completed by workers
- Amount of material used
- On-time completion
- Bids created
- Gross profit
- Labor-hours for production
The list barely scratches the surface of the many indicators that could be measured and monitored to assure that our workers are focusing on the right performance. Quite honestly, there should be little mystery to determining the important indicators.
Remember, it is critical to consider those indicators that truly reflect most closely how our company (i.e. crews, department, etc.) is performing. For most of the indicators, the measurement will be a comparison against “hours” or what percentage against our budget or estimate was realized.
How should selected indicators be measured?
Now we get to sink our teeth into the actual numbers. First, consider a few of the possible measurements that are often embraced and tracked by construction companies worldwide.
- Square feet/labor hour (formwork)
- Cubic yards poured/labor hour
- Linear feet/labor hour
- Number of block/labor hour (masonry)
- Safety incidents/week
- On-time job completion/schedule
- Equipment “uptime”
- $ average/call-back
There is a host of means to measure our productivity, but the key is again to measure what is truly reflective of our performance and in such a way that our workers can understand what the measurements mean to them.
Here’s a brief example outlining the importance of measuring the right productivity for your workers:
Let’s say that you need to have a formwork crew complete the first floor of a parking garage in one week’s time so that concrete can be poured. Such general direction is much different than informing the crew that we need to average 16 square feet per labor hour worked in order to complete the first floor within one work week. The “16 square foot per labor hour” becomes a measurement that can be calculated, measured and monitored.
While the first approach certainly provides the workers with a general overview that the first floor is to be completed in one week, the more specific target of “16 square feet per labor hour” provides a clearer goal for the crew to work toward achieving or beating.
When measuring it is sometimes useful to measure the actual performance achieved against what was estimated. This comparison is sometimes reflected as a percentage. For example, you might reflect how much linear feet of pipe was laid, or linear feet of striping applied, per labor-hour, compared against what the estimate was for.
So, a crew that produced 93% of linear pipe/labor hour would indicate that the crew placed 93% of what the estimate called out to place. (This is why capturing accurate production numbers is very important to the honesty and helpfulness of the Team Scoreboard.)
How should the measurements be reflected on the scoreboard?
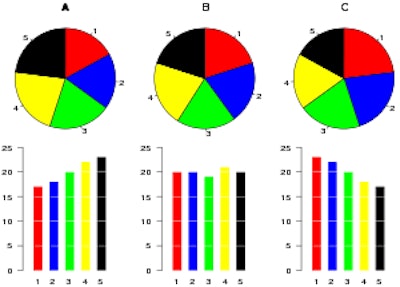
Most of the successful approaches that I’ve witnessed and assisted companies embrace use one of several forms of graphs, include:
- Run charts
- Pie graphs
- “X & Y” graphs
The use of graphs can be easily developed, and even the least educated worker can be taught to consider trends of productivity. “Line moving up represents improvement; line moving down represents declining performance. A larger piece of the pie represents good performance while a smaller ‘slice’ might represent less performance.”
As the old saying goes, “A picture is worth a thousand words.” Ideally I would suggest that you use a graph, of your choice, for each performance indicator to be measured. Placing three, five, even seven such graphs on one copy of paper or perhaps enlarged to be placed on a poster-sized board will bring greater visibility and interest from your workers.
A key point here as well is to keep the monitoring updated. For example, if you are tracking any indicator on a weekly basis, update and change out the graph reflecting the performance of the previous week. Leave such updates posted for at least one week, allowing the employees most associated with impacting the indicators a chance to review and reflect. It is common for the direct supervisor to engage in discussion about the graphs' story and how the crew can improve their performance or to maintain the great effort reflected by the graphs.
How do you gain the employee’s interest in the Team Scoreboard?
To gain more interest by those workers who are impacting the numbers you’ll need to communicate the information quickly and often.
It is important that if you are measuring daily and reflecting weekly then ensure that your Team Scoreboard is updated with each new week. This effort alone will attract viewers at the posting of each new graph.
You must communicate with your workers about the graphs, the story that they tell, and most importantly, what can we learn from the results that are displayed. In the big picture of things, construction really is an industry focused on installing materials in a way that a finished product is achieved. Measuring our ability to do such installations provides us with a “how well are we doing?” at our craft.
Use the Team Scoreboard to praise your workers together. You have more than enough opportunity to recognize individual performance when it requires it, but using the Team Scoreboard to address “team” items can go a long way toward building greater team thinking and building.
Finally, to gain the employee’s interest in the Team Scoreboard you must also be very interested. If you post the regular updates but seldom address positive trends you will leave your workers wondering what they have to do to get a “thank you team.” As a leader, if you will not even address the team when their weekly performance is “sliding south and fast” then they are left to believe that perhaps what they are doing is not that important.
Developing the Team Scoreboard is another great communication tool that effective leaders use to raise their workers “Performance IQ” toward working smart and safe. Look for a space on a wall that is regularly passed by workers coming and leaving the office or the yard and begin to post the graphs representing the performance of the recent week.
The Team Scoreboard can raise worker productivity, lead to more effective and timely problem solving, raise the amount of respect your workers begin to have for you and their teammates, grow the pride within the workers to achieve high marks of performance.