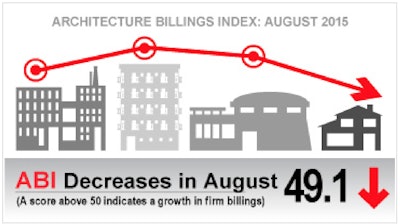
The Architecture Billings Index (ABI) slipped in August after showing mostly healthy business conditions so far this year. The American Institute of Architects (AIA) reported the August ABI score was 49.1, down from a mark of 54.7 in July. This score reflects a slight decrease in design services (any score above 50 indicates an increase in billings). The new projects inquiry index was 61.8, down from a reading of 63.7 the previous month.
As a leading economic indicator of construction activity, the ABI reflects the approximate nine to 12 month lead time between architecture billings and construction spending.
“Over the past several years, a period of sustained growth in billings has been followed by a temporary step backwards,” said AIA Chief Economist Kermit Baker, Hon. AIA, PhD. “The fact that project inquiries and new design contracts continue to grow at a healthy pace suggests that this should not be a cause for concern throughout the design and construction industry.”
Key August ABI highlights:
All four regions saw a drop in their regional averages:
- Midwest 56.1 (down from 58.2 in July)
- South 53.8 (down from 55.7 in July)
- West 50.2 (down from 53.8 in July)
- Northeast 46.8 (down from 53.5 in July)
All four major sectors saw a drop in their averages compared to July:
- Institutional 53.7 (down from 57.3 in July)
- Mixed practice 52.8 (down from 56.8 in July)
- Commercial / industrial 49.7 (down from 53.4 in July)
- Multi-family residential 49.5 (down from 49.8 in July)
Other key numbers:
- Project inquiries index: 61.8 (down from 63.7 in July)
- Design contracts index: 55.3 (down from 54.4 in July)
The regional and sector categories are calculated as a three-month moving average, whereas the national index, design contracts and inquiries are monthly numbers.