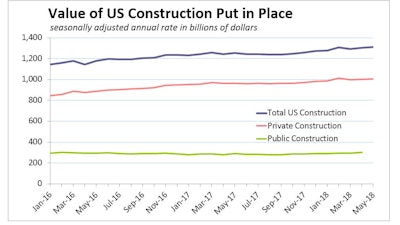
The total value of U.S. construction put in place fell short of expectations with a 0.4% increase in May, while April’s originally estimated 1.8% gain was revised down to 0.9%. Public expenditures grew 0.7%, while private spending increased 0.3%.

Nevertheless, spending appears on solid footing and is up 4.3% year-to-date through May.
Residential outlays are up 6.4% compared to the same period in 2017, while nonresidential outlays are up 2.7%.
Residential spending increased 0.8% and accounted for much of the gain in May. Multifamily expenditures grew 1.6%, while single family increased 0.6%. After recent volatility, spending on improvements rose 0.4%.
Nonresidential outlays increased 0.1% in May; however, the gain was owed entirely to public spending, which grew 0.7%.
Related: Caterpillar Could Rebound on Strong Construction Spending Report