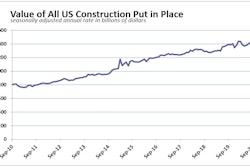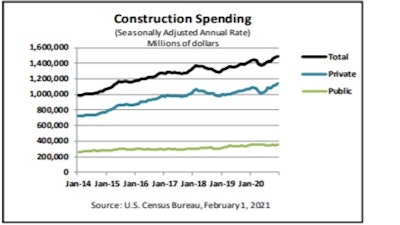
The U.S. Census Bureau issued its monthly construction spending report on February 1 detailing the value of construction put in place for December 2020. Total construction for the month was estimated at a seasonally adjusted annual rate of $1,490.4 billion, just 1.0% above the revised November estimate of $1,475.6 billion.
Despite the influence of the COVID-19 pandemic, the December 2020 figure was 5.7% above December 2019’s estimate of $1,410.3 billion. The value of construction in 2020 was $1,429.7 billion, 4.7% above the $1,365.1 billion spent in 2019, led largely by solid growth in the residential construction segment.
Private Construction
Spending on private construction was at a seasonally adjusted annual rate of $1,137.6 billion, 1.2% above the revised November estimate of $1,124.4 billion.
Residential construction came in at $691.0 billion in December, 3.1% (±1.3%) above the revised November estimate of $670.1 billion. New single-family construction saw gains of 5.8% for the month, with multi-family largely flat (+0.1%).
Nonresidential construction was at a seasonally adjusted annual rate of $446.6 billion in December, 1.7% below the revised November estimate of $454.4 billion.
- Lodging (-6.4%) and manufacturing (-5.6%) posted the largest declines for the month.
- A modest gain was seen in transportation (+2.2%), with most other sectors largely flat or with only slight declines.
The annual value of private construction for full year 2020 was $1,079.3 billion, 4.7% above the $1,030.7 billion spent in 2019.
Residential construction in 2020 came in at $607.6 billion, 11.6% above the 2019 figure of $544.4 billion. Single-family led with a gain of 7.9% with new multifamily construction coming in slightly behind at +6.3%.
Nonresidential construction was $471.7 billion, 3.0% below the $486.3 billion in 2019.
- Public safety (-51.5%) and sewage and waste disposal (-45.8%) saw substantial declines but combined represent just $479 million of the total private construction market.
- The largest gain was in another modest market segment, water supply (+36.9%), up from $352 million in 2019 to $$482 million in 2020.
- Among the largest market segments, power saw an increase of 4.8%, rising from $107.1 billion in 2019 to $112.3 billion in 2020, while manufacturing fell 10.3% to $71.5 billion from $79.8 billion.
Public Construction
In December, the estimated seasonally adjusted annual rate of public construction spending was $352.8 billion, up just 0.5% from the revised November estimate of $351.1 billion.
- Educational construction was at a seasonally adjusted annual rate of $90.2 billion, 0.6% above the revised November estimate of $89.7 billion.
- Highway construction came in at $98.4 billion, 0.9% above the revised November estimate of $97.5 billion.
- Office construction saw the largest decline for the month (-6.4%), followed by manufacturing (-5.6%) and health care (-3.0%).
The value of public construction in 2020 was $350.5 billion, 4.8% above the $334.4 billion spent in 2019.
- Public safety experienced the largest growth from $10.3 billion to $14.9 billion (+44.5%), while water supply rose from $15.5 billion to $18.0 billion (+16.2%).
- Among the largest public market segments, educational construction in 2020 rose to $87.3 billion, 3.6% above the 2019 figure of $84.3 billion and highway construction was $98.8 billion, an increase of 1.8% from $97.1 billion in 2019.