Associated Builders and Contractors' (ABC) Construction Backlog Indicator (CBI) expanded by 1% to 8.5 months during the 2nd quarter of 2015. Backlog declined 3% during the 1st quarter, which was punctuated by harsh winter weather and the lingering effects of the West Coast ports slowdown. CBI stands roughly where it did a year ago, indicative of an ongoing recovery in the nation's nonresidential construction industry.
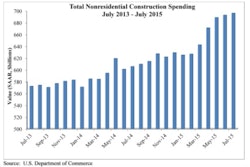
Strongest 12-Month Growth for Nonresidential Construction Spending Since 2008
"The nation's nonresidential construction industry is now one of America's leading engines of growth," said ABC Chief Economist Anirban Basu. "The broader U.S. economic recovery is now in its 74th month, but remains under-diversified, led primarily by a combination of consumer spending growth as well as residential and nonresidential construction recovery. Were the overall economy in better shape, the performance of nonresidential construction would not be as closely watched. The economic recovery remains fragile despite a solid GDP growth figure for the second quarter, and must at some point negotiate an interest-rate tightening cycle. Recent stock market volatility has served to remind all stakeholders how delicate the economic recovery continues to be.
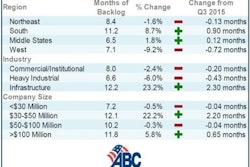
"Though CBI expanded during the second quarter, performance continues to be uneven," Basu said. "A surge in heavy industrial investment in the Middle States, including in the auto sector, and technology-led growth in the West were responsible for the bulk of second-quarter momentum. Backlog actually slipped in the infrastructure category, which remains hamstrung by uncertainties lingering around the Highway Trust Fund. Backlog was not statistically significantly different in the South between the first and second quarters.
"The national outlook continues to be positive," said Basu. "The most consistently upbeat information regarding U.S. economic performance continues to emerge from the labor market. The nation added more than 2.9 million jobs between July 2014 and July 2015, enough to help drive down office and other commercial vacancy rates in many major markets despite ongoing construction.
"Also consider the tendency for commercial construction to follow residential construction. To the extent that remains true, the recent uptick in residential starts should translate into more commercial starts going forward. All of this should set the stage for further rebounds in CBI during the quarters to come, even in the absence of a long-term policy regarding infrastructure investment in the U.S."
For additional analysis click here
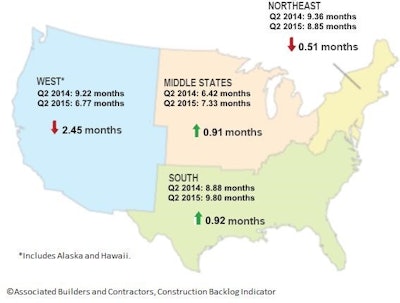
Regional Highlights
- The West experienced a significant expansion in backlog, rising 1.2 months following the resolution of the West Coast port slowdown, however backlog in the region remains nearly 2.5 months below its year-ago levels, the largest drop of any region.
- Backlog in the South has essentially returned to where it was two years ago, in part because of a slowdown in energy-related investment. The implication is that the average contractor remains busy, but boom-like conditions no longer prevail in energy-intensive communities.
- Despite this, backlog in the South continue to hold the longest average construction backlog.
- Backlog slipped for a second consecutive quarter in the Northeast, but remains above levels registered during the second half of 2013.
Industry Highlights
- Backlog in the heavy industrial segment has never been higher during the length of the series, penetrating the seven-month mark for the first time. This represents an increase of more than two months in average backlog over the past two years. Average backlog was below five months during 2013's second half.
- Industrial backlog has continued to rise despite the strength of the U.S. dollar, which has contributed to limited export growth.
- Commercial/institutional backlog has remained above eight months on average for twelve consecutive quarters, a reflection of America's steady rate of employment expansion.
- Backlog for all industry segments is higher on a year-over-year basis with exception of the commercial/institutional segment. Commercial/institution construction segments have been among the most active from a construction spending perspective in recent years. Therefore, the small adjustment in average backlog is not particularly worrisome.
Highlights by Company Size
- On a quarterly basis, backlog rose or remained flat across all firm sizes.
- Average construction backlog is higher or roughly the same as year-ago levels for firms of all size categories with the exception of a half-month drop in backlog among firms generating $100 million or more in annual revenues.
- TThe largest firms, however, continue to have the lengthiest average backlog at 10.7 months.
To read more about the latest CBI, click here.