Total U.S. construction spending in October rose 0.5% to a seasonally adjusted annual rate of $1,172.6 billion on the first significant growth in public construction spending since January.
October was the sixth consecutive month that growth in total value of U.S. construction put in place was well within the margin of error of the Department of Commerce’s monthly estimates.
The value of public construction in October rose 2.8% to an annual rate of $286.8 billion. The turnaround is welcome in a category where the average of year-to-date annual spending rates is 4.2% below that of the first ten months of 2015.
Highlights in public spending include 1.9% growth in the highway and street category to $91.5 billion and 4.1% growth in spending on educational facilities to $72.2 billion. The only public spending category that fell was a 2.1% drop in the health-care category to $8.8 billion.
Spending on private construction eroded 0.2% to an annual rate of $885.9 billion, its second month of essentially unchanged spending.
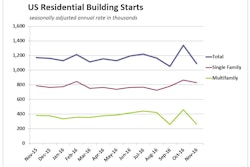
The two private residential spending categories grew by a matched 2.8%, carrying single-family spending to a seasonally adjusted annual rate of $243.5 billion, and multifamily to $ 63.7 billion. Total residential investment rose 1.8% in October, and is 4.6% above October of 2015.
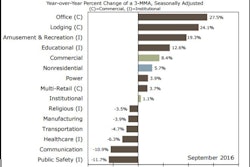
All of the four largest private nonresidential spending categories (representing 70% of October’s total private nonresidential spending) saw monthly declines:
|
|
October 2016 Private Nonresidential Spending |
|
||
|
|
Annual spend rate |
Monthly change |
Compared to 2015 |
|
|
Power |
$84,986,000 |
-4.3% |
3.3% |
|
|
Manufacturing |
$73,365,000 |
-2.4% |
-8.3% |
|
|
Commercial |
$70,657,000 |
-0.7% |
6.1% |
|
|
Office |
$62,671,000 |
-2.0% |
28.4% |
|


![[VIDEO] Conditions Shaping up for a Q4 Multifamily Housing Boom](https://img.forconstructionpros.com/files/base/acbm/fcp/image/2016/12/default.5848742d39c31.png?auto=format%2Ccompress&fit=crop&h=167&q=70&w=250)