Mobile app: deciBel Pro
Developer: BSB Mobile Solutions
Cost: $3.60
Available on: Android devices
Designed to make an Android-based SPL meter as close to a professional-grade device as possible, the deciBel Pro mobile app measures and calculates how loud the noises around you are. The app uses a Fast Fourier Transform algorithm to implement high precision A, B, C and Z weighting filters and sophisticated digital signal processing techniques to achieve the best possible SPL readings on your Android phone or table.
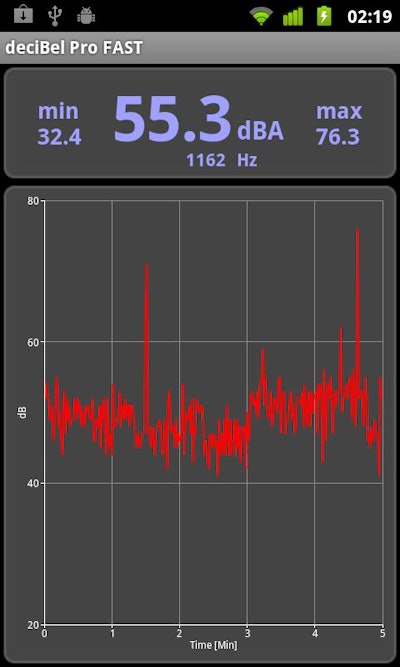
The app displays the current, maximum and minimum values in decibels, and generates three kinds of sound pressure level versus time charts. The display can be rotated to allow pointing the mic at the sound source.
The app features both a fast and a slow mode. Fast mode is the default screen that displays the current, maximum and minium sound pressure levels in decibels as well as displays a moving dB x time chart. Both the display and charge are updated every second. The chart continuously slides to show the last five minutes of the recording.
Slow mode features a chart that is updated once every 15 seconds and allows the user to resize the time axis to 15, 30, 60 or 120 minutes. The chart in slow mode shows three lines: the 15 second average, the minimum and the maximum.
App features:
- True A, B, C and Z Weighting (ANSI S1.4)
- Numeric dB, dBmin and dBmax display
- Simple calibration interface
- Automatic Calibration function (no professional SPL meter required for reasonable startup accuracy)
- Sliding sound level versus time chart
- Sliding max, min and average sound level versus time chart
- Accumulated sound level exposition chart (dosimeter)
- Accumulated Exposition Time mode uses a histogram to show how many times the device was exposed to each sound pressure level since the beginning of the measurement
- Saves chart screenshots to the SD card
- Dominant frequency display
- 22Khz bandwidth at the input of the weighting filter
- 1024 point real time FFT and digital sound processing
- Movable to the SD card
- Reset All option resets the displayed maximum and minimum values to restart the logging charts
- Calibration Panel allows user to trim the deciBel sound pressure meter to that particular hardware for precise measurements