By way of comparison, June versus May was +35.7 percent. A surge of project authorizations at the beginning of summer has been followed by a significant retreat. The latest month was a return to equilibrium as established over the past several years.
July’s volume of $26.1 billion was still the second-highest in the year. June’s $32.4 billion was one of the strongest monthly figures in Reed’s entire data base.
July 2014 was 1.4 percent above July 2013. Year-to-date starts in 2014, at $164.9 billion, have been +4.8 percent versus the same January to July period of last year.
The starts figures are in “current” dollars, meaning they are not adjusted for inflation.
“Non-residential building” plus “engineering/civil” work accounts for a considerably larger share of total construction than residential activity. The former’s combined proportion of total put-in-place construction in the Census Bureau’s June report was 63 percent versus the latter’s 37 percent.
Reed’s construction starts are leading indicators for the Census Bureau’s capital investment or put-in-place series.
The economy is on a growth path that is not being mirrored in construction starts. Nearly a quarter-of-a-million jobs (230,000) have been created on average through the first seven months of this year. Initial jobless claims have fallen below 300,000 in two of the last four weeks.
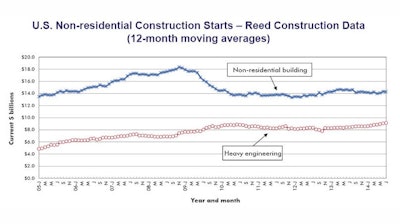
The level of pent-up demand for construction continues to accumulate. Nonresidential building starts are no higher now than they were eight to 10 years ago; nor are infrastructure needs being met for a population that is growing at an annual pace of 0.7 percent to 0.8 percent.
Among the major categories, commercial starts in July (-31 percent) suffered the largest month-to-month decline, followed by heavy engineering work (-10.2 percent). Institutional (-0.3 percent) was essentially flat. Industrial starts (-95.5 percent) ‒ a category with a much lower dollar volume than the other three ‒ all but disappeared.
Compared with the same month of last year, 2014’s July institutional starts (+15.5 percent) were up nicely. Heavy engineering work (+8.3 percent) also recorded a solid gain. Commercial starts (-18.9 percent) continued to fall behind. Industrial’s volume (-73.2 percent) was insignificant.
In year-to-date starts, the heavy engineering category (+11.8 percent) has been out front, followed by institutional (+7.2 percent) and industrial (+4.6 percent). Again, it’s commercial work (-7.1 percent) that languishes.
Within commercial, a decent performance in the latest month by retail (+3.8 percent month over month; +28.2 percent year over year; but -3.4 percent year to date) has been more than offset by private office buildings (-49.8 percent m/m; -60.8 percent y/y; but +6.2 percent ytd) and hotel/motel work (-10.0 percent m/m; -59.9 percent y/y; and -7.7 percent ytd)
Institutional construction has been finding support from school and college construction (-13.6 percent m/m; but +15.1 percent y/y; and +10.2 percent ytd), while hospital/clinic work (-2.5 percent m/m; -45.0 percent y/y; and -18.8 percent ytd) has been reluctant to proceed.
Engineering starts are receiving a lift from their largest sub-component, roads and highways (+5.2 percent m/m; +15.7 percent y/y; and +9.7 percent ytd). Water/sewage work (-22.6 percent m/m; +4.8 percent y/y; and +13.0 percent ytd) weakened in the latest period, but has held up fairly well versus July of last year and when compared with 2013 on a year-to-date basis.
Among other indicators for construction, the news is more encouraging. The jobless rate is a quite low 7.5 percent. That level compares favorably with a previous ten-year average, specifically for July, of 10.2 percent. The sector is adding jobs (+3.6 percent year over year) at a faster pace than not only the total economy (+1.9 percent), but also services (+2.1 percent) and manufacturing (+1.5 percent).
Year-over-year employment in architectural and engineering services in July was +4.5 percent, the fastest rate of gain since February 2007’s +4.7 percent. To demonstrate the degree of improvement, there was a 10.0 percent decline in mid-2009 as the Great Recession bit hardest. Along the construction pipeline, the “drawing board” stage is in advance of both starts and the hiring of on-site workers.
The value of starts each month is summarized from Reed’s database of all active construction projects in the U.S. Missing project values are estimated with the help of RSMeans’ building cost models.


