Mobile app: Epicflow
Developer: GLOW Management
Cost: Price varies for Basic and Premium Users
Available on: Web, Apple and Android devices
Access real-time updated on a desktop or a mobile device any time, any where with Epicflow. The web-based software program and its free companion mobile app allow contractors to access real-time data to track resource bottlenecks in advance, run “what if” scenarios to fix bottlenecks and adjust changes with just a few clicks. With Epicflow, contractors can manage construction site progress from a single dashboard.
Epicflow can be used as a standalone app or integrated into MS Project and Primavera.
There are three pricing plans on request. All plans include the full-featured software, version updates, web and mobile apps, and integration with MS Project and Primavera. You can get access to a free trial for a month after a short online demonstration with Epicflow.
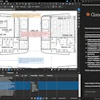
One of the main features of Epicflow is it’s pipeline feature. With the pipeline, contractors have complete visibility over ongoing projects and milestones all in one place. Users can see future constraints marked in red, which can help reduce risks and give users time to take preventive actions. A dynamic Gantt view that updates based on adjusted changes is also available.
Epicflow also allows contractors to run “what-if” analysis. This functionality helps contractors see what will likely happen if the project continues to proceed the way things are happening now.
App features:
- Works in tandem with MS Project, Jira, TOPdesk, Primavera and CA Clarity
- Set priority lists from a phone
- Monitor workloads
- Adjust remaining hours
- Historical load graph shows group performance, capacity, load and output over time
- Future load graph reflects causes of constraints and spare capacity of resource groups
- Bubble graph shows bird’s-eye view of how projects are developing over time
- Task list automatically suggests best possible combinations of task priorities out of all tasks across all construction projects in real time
- Dazzle Dashboard shows trends across multiple projects