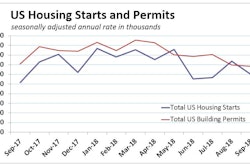
Construction spending edged up 0.1% in August with significant contributions from public spending categories, according to the U.S. Department of Commerce’s monthly estimates of the value of construction put in place. Much of the gain occurred in nonresidential outlays, which increased 0.7%, while residential spending dropped 0.7%. Total spending year-to-date is now 5.3% higher than in the first eight months of 2017.

There were also August declines in substantial non-residential segments: power, commercial and manufacturing. These were counterbalanced in part by 1.9% growth in office construction spending and rising health-care, lodging and amusement spending. But much of the August energy came from government-spending-dominated construction segments such as highway and street, educational, water and sewer construction.
Nonresidential outlays have increased in each of the past 12 months and are up 4.4% year-to-date, driven by public spending on highway and street projects, educational building and transportation facilities. Increases this year in private spending on commercial and office construction, power, transportation and lodging construction are also significantly above their 2017 levels.
“Nonresidential spending should continue to be solid in the second half of the year,” according to the Wells Fargo Economics Group’s analysis of the Commerce Dept.’s August numbers. “The Architecture Billings Index, which leads construction activity by nine to 12 months, has been solidly in expansion territory this year, notably in the South.”